Theory of Employment and Public Finance Questions and Answers AP Inter 1st Year Economics Chapter 9

Regular practice with AP Inter 1st Year Economics Study Material Chapter 9 Theory of Employment and Public Finance Questions and Answers helps students stay prepared for examinations.

AP Inter 1st Year Economics 9th Lesson Theory of Employment and Public Finance Questions and Answers

Essay Questions

Write an essay on the following questions.

Question 1.
Elucidate the classical theory of employment.
Answer:
The classical theory of employment was developed by Economist such as Adam Smith, David Ricardo, Robert Mathus, etc. It is based on the famous “Law of Markets” advocated by J.B. Say. According to this law, “Supply creates its own Demand”.

The implications of the classical theory of employment may be summarized as follows.

  1. There is no general over production and general unemployment.
  2. There is an automatic adjustment of demand and supply levels through the price mechanism.
  3. There is no need for the interference by the government.
  4. The whole income is spent. Even if there is saving, all savings will be gradually spent on capital goods. Thus the whole income is spent either on consumption good or on capital goods. It means savings and investments are equal.
  5. Flexible interest rate keeps saving and investment in equilibrium.
  6. Flexible wage rate brings about equilibrium in the labour market.
  7. It is possible to increase output and employment as long as there are unemployed or idle resources.
  8. Goods are exchanged for goods. Money facilitates such exchange of goods. Hence, money has no other role except acting as medium of exchange.

Salient features of Classical Theory of Employment: The classical economists held the view that in a capitalistic economy, there is always a stable equilibrium at full employment level in the long run under conditions of perfect competition.

They consider full employment as a general feature and unemployment a rare phenomenon. If there is unemployment at anytime, the economy has a tendency to move towards full employment. There would be automatic adjustment through free play of market forces, provided there is no interference by the government. Thus, the classical economists ruled out any general unemployment in the long run. These views are broadly known as the classical theory of output, income and employment.

Assumptions of classical theory of employment : The classical theory of employment including J.B. Say’s market law is based on the following assumptions :

  1. There is a free enterprise economy.
  2. There is perfect competition in the economy.
  3. There is no government interference in the functioning of the economy. Price mechanism is allowed to work freely.
  4. The equilibrium process is considered from the long term point of view.
  5. All savings are automatically invested.
  6. The interest rate is flexible.
  7. The wage rate is flexible.
  8. There are no limits to the expansion of the market.
  9. Money acts as the medium of exchange and it has no role to play in the determination of output and employment. It is neutral.

The classical theory of employment can be discussed with three dimensions:

A) Goods market equilibrium.
B) Money market equilibrium and
C) Equilibrium of the labour market (Pigou wage – cut policy).

The equilibrium of the first two markets was propounded by J.B. Say, whereas the third one was advocated by A.C. Pigou.

Question 2.
Describe the Keynesian theory of employment with the help of diagram.
Answer:
The classical employment theory assumed that there is always full employment in the economy. The classical economists consider full employment as a general situation in the long run. But J.M. Keynes criticized it and he considered full employment as a rare phenomenon. He considered full employment as special case in short run.

J.M. Keynes stated his employment theory in his famous book entitled “The General Theory of Employment, Interest and Money”, published in 1936. His theory is known as Keynesian theory of employment.

He says that the level of employment is determined by two factors.

  1. Aggregate supply
  2. Aggregate demand.

The term effective demand is used to denote that level of aggregate demand which is equal to aggregate supply.

Aggregate Supply: Aggregate supply refers to the total supply of goods and services in the economy. The level of aggregate supply depends on the level of employment. The minimum amount of money which the producers in the economy must receive by selling the goods and services at different levels of employment is called aggregate supply price. As the level of output increases with the level of employment the aggregate supply price also increases with every increase in the level of employment.

Aggregate Supply Schedule: It shows the various amounts of supply at different levels of employment. It is shown in the table given below.

Level of employment
(in lakhs of workers)
Aggregate supply price
(in crore of rupees)
10500
11550
12600
13650
14700
15750
16800

From the above table, we know that as employment increases aggregate supply is increasing. So there is a direct relationship between level of employment and aggregate supply.

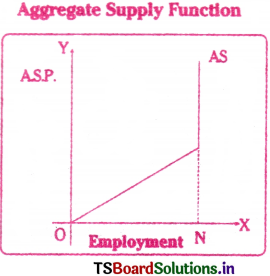
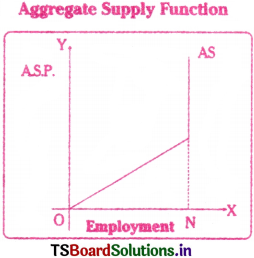
Aggregate Supply Curve: If the above schedule is shown in graph, then we get a curve. This curve is called aggregate supply curve.

Aggregate supply curve can be seen sloping upwards from left to right. It started from the origin which means the aggregated supply is zero, when the employment is nil.
Theory of Employment and Public Finance Questions and Answers AP Inter 1st Year Economics Chapter 9 1

In the adjacent diagram as employment levels increase the AS curve rises to the right. ON is assumed to be full employment level. At this level, aggregate supply the function AS is parallel to Y – axis which means that the aggregated supply is perfectly inelastic.

Aggregate Demand : Aggregate demand means the total demand for all commodities in the economy at a particular level of employment. The amount they spend on consumption goods is called consumption expenditure (C) and their expenditure on capital goods is called investment (I). The entrepreneurs expect that the community as a whole is willing to spend certain amount towards purchase of the total output. That expected expenditure is termed as aggregate demand price.

Aggregate Demand Schedule : It shows the aggregate demand at different levels of employment. As the level of employment rises, the total income of the community also rises and therefore the aggregate demand price also increases. This can be seen in the following table.

Aggregate Demand Function

Level of employment
(in lakhs of workers)
Aggregate demand price
(in crore of rupees)
10600
11625
12650
13675
14700
15725
16750

In the above table, as employment increases AD also increases. So there is direct relationship between levels of employment and aggregate demand.

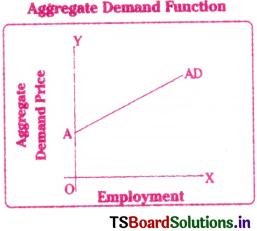
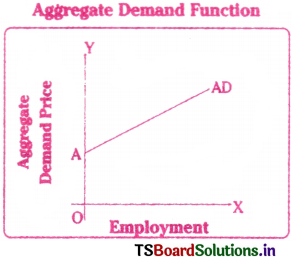
Aggregate Demand Curve : If the AD schedule is shown on a graph, then we get a curve. This curve is called aggregate demand curve. This is shown in the diagram given adjacent:
Theory of Employment and Public Finance Questions and Answers AP Inter 1st Year Economics Chapter 9 2

In the adjacent diagram, AD curve is the aggregate demand curve. It slopes upwards from left to right.

Effective Demand : The level of employment will be in equilibrium at a point where aggregate demand and aggregate supply are equal. The aggregate demand at which it is equal to aggregate supply is called effective demand. This is shown in the table given below.

Effective Demand

Levels of employment
(in lakhs of workers)
Aggregate supply price
(in crores of rupees)
Aggregate demand price
(in crores of rupees)
10500600
11550625
12600650
13650675
14700700
15750725
16800750

In the above table, at the employment of 14 lakhs, the aggregate supply and aggregate demand are equal. At the level of employment of below 14 lakhs, aggregate supply is less than aggregate demand. Similarly, at the level of employment of above 14 lakhs aggregate supply is more than aggregate demand.

Only at the level of 14 lakhs the A.D and AS are equal. Hence, it is called effective demand.
Theory of Employment and Public Finance Questions and Answers AP Inter 1st Year Economics Chapter 9 3

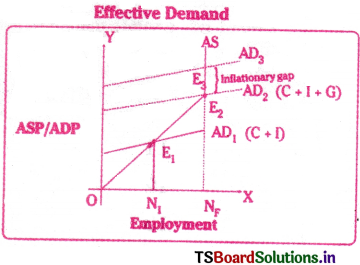
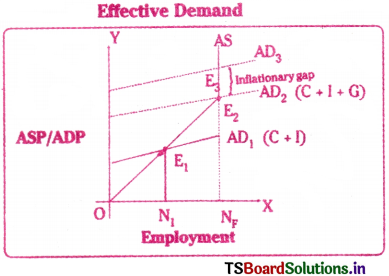
In this diagram, Aggregate demand price curve (AD) and aggregate supply price curve (AS) intersect each other at point E1“. It shows the equilibrium point. The equilibrium has been attained at “ON1”, level of employment. It is assumed that ON in the above diagram does not indicate full employment as the economy is having idle factors of production. So it is considered as under-employment equilibrium.

According to Keynes, to achieve full employment an upward shift of aggregate demand curve is required. This can be possible through government expenditure on goods and services supplied in the economy, whenever private entrepreneurs may not show interest to invest. With this the AD1 curve (C + I) shifts as AD2 (C + I + G) at new point of effective demand E2, where the economy reaches full employment level i.e., ONF.

Question 3.
Explain various methods of redemption of public debt.
Answer:
When the government’s expenditure exceeds its revenue, the government can borrow funds from various sources within the country or from abroad. Such debts are known as public debt.

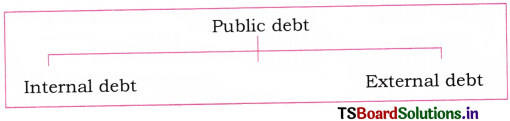
On the basis of the sources, public debt is classified into two categories
Theory of Employment and Public Finance Questions and Answers AP Inter 1st Year Economics Chapter 9 4

Internal debt: It is the fund which is borrowed by a government from the people and institutions within the country. In other words, debts floated within the country is called internal debt.

External debt: It is the fund or amount which is borrowed by a government from the individuals, institutions, and governments of other countries, (or) In other words, debt floated from abroad is called “external debt”.

Redemption of public debt: Repayment of debt by government is called redemption of public debt. Internal debt can be repaid in the domestic currency, but to repay external debt foreign exchange is necessary (dollars,…………………).

The following are the methods of redemption of public debt.

  1. Surplus budget: Surplus budget means having public revenue is excess of public expenditure. If the government plans for a surplus budget, the excess revenue may be utilized to repay public debt.
  2. Refunding : In this method, the government sells new bonds and securities in the market and the money thus raised is utilized for the repayment of old or maturing debts.
  3. Annuities : By using this method, the government repays part of the public debt every year. These are called annuities. Such annual payments are made regularly till the debts are completely cleared.
  4. Sinking fund : By using this method, the government creates a separate fund called ‘sinking fund’ for the purpose of repaying public debt. A part of the public revenue is deposited into fund every year. Public debt is repaid from the sinking fund. This method is considered as the better method of redemption.
  5. Conversion : Conversion means that existing loans are changed into new loans before the date of their maturity. This method is advantageous when the rate of interest charged on the new loans is less than the rate of interest to be paid on the existing loans.
  6. Additional taxation : The government can levy new taxes and raise funds for the repayment of old debts. Under this method new taxes are imposed.
  7. Capital levy : It is a heavy one – time tax on the capital assets and estates.
  8. Surplus balance of payment: This is useful to repay external debt for which foreign exchange is required. Surplus balance of payment implies exports in excess of imports by which reserves of foreign exchange can be created.

Question 4.
Describe various components of a budget.
Answer:
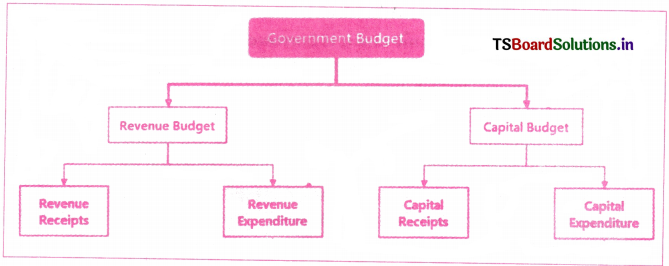
The government budget consists of two main components: Revenue Budget and Capital Budget. They are presented as revenue account and capital account in the budget documents. Each consists of receipts and expenditure as shown below.
Theory of Employment and Public Finance Questions and Answers AP Inter 1st Year Economics Chapter 9 5

I. Revenue Budget :

a) Revenue Receipts: Revenue receipts are those receipts that do not lead to a claim on the government. They are therefore termed non-redeemable. They are divided into tax and non-tax revenues, tax revenues are divided into direct taxes and indirect taxes. Non-tax revenue consists of interest receipts, dividends and profits on government investments.

b) Revenue Expenditure: Revenue expenditure is expenditure incurred for purposes other than the creation of physical or financial assets of the central government. It relates to those expenses incurred for the normal functioning of the government departments and various services, such as interest payments, subsidies, and pensions,

II. Capital Budget :

a) Capital Receipts: These include market loans and borrowings. Market loans are raised from the public by floating bonds and securities. Borrowings include loans raised from the Reserve Bank of India and financial institutions by selling Treasury Bills. The government may also receive loans from World Bank and IMF. Another source is small savings such as National Savings Certificates, Provident Fund etc. The government also receives money by way of loans or from the sale of its assets. Loans will have to be returned to the agencies from which they have been borrowed. Thus, capital receipts liabilities for the government.

b) Capital Expenditure: Capital expenditure refers to the government spending that results in the creation of physical or financial assets or the reduction in financial liabilities. This includes expenditure on the acquisition of land, buildings, machinery, equipment, investment in shares, and loans and advances by the central government to state and union territory governments.

Question 5.
How does Keynes advocate government expenditure to reduce un¬employment? Explain. ‘
Answer:
J.M. Keynes was one of the famous British economist of the 20th century. According to Keynes theory, lack of effective demand is the basic cause for unemployment in India.

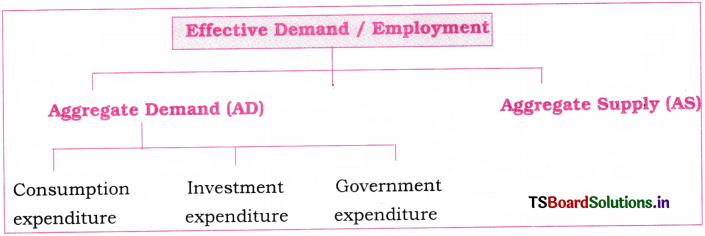
Keynes suggests that unemployment can be removed and full employment level reached by increasing the aggregate demand. Aggregate demand consists of consumption expenditure (C) and investment (AD = C + I).

Keynes opines or believes that in short run it is not possible to raise consumption expenditure and therefore suggested that aggregate demand can be raised by increasing investment. In order to encourage private investment the government should reduce rate of interest. However he argued that the organisers in private sector may not be willing to come forward to increase private investment, when they are not optimistic. In this situation, the government should spend on public works. The government expenditure raises aggregate demand and removes unemployment.
Theory of Employment and Public Finance Questions and Answers AP Inter 1st Year Economics Chapter 9 6

In the view of Keynes, the level of employment in the short run will depend on effective demand for goods in the country. Greater the effective demand leads higher volume of employment and vice – versa. Total employment depends on total demand and unemployment is result of a deficiency of total demand. Effective demand represents the total money spent on consumption and investment. The total national expenditure is equal to total national income which is equal to national output.

So Effective Demand = National Income (Y) = National Output (O)

Effective demand determines the volume of employment in the economy at a particular time, the deficiency of effective demand in employment. The deficiency of effective demand is due to the gap between income and consumption. As income increases, consumption also increases but it is in a smaller proportion than the increase in national income. Since consumption is less, the demand is less. The gap must be filled by increasing investment and hence effective demand. In order to maintain employment at high level. Thus it is increase in effective demand which results in increase in employment or total output or national income.

In terms of expenditure, effective demand means, the total expenditure of the community at a particular level of employment. This expenditure is just equal to economy’s aggregate supply. So effective is the aggregate or total demand of community both for consumption and investment.

Theory of Employment and Public Finance Questions and Answers AP Inter 1st Year Economics Chapter 9

Question 6.
Discuss how the Keynesian Theory is an improvement over the classical theory of employment.
Answer:
Keynesian theory has a greater particular value in the world of reality. Keynesian theory is entirely new and marks a revolutionary thinking. So it has been aptly called a Keynesian Revolution. Based on cary some point Keynesian theory is better than classical theory of employment.

Keynesian theory relates to Macro Economics, which studies the economy as a whole but the classical economic theory deals with the individual aspect of the economy that is Micro Economics. Keynes, dealt with Aggregates. Whereas classical economics system, in terms of it innumerable decision – marking units. The classical economists believed that a state of full employment could be brought about through cuts in money wages. But Keynes held that this theory was not only unrealistic but theoretically unsound.

According to Keynes, lowering of wages in any particular industry might increase employment there. But in reality reducing wages caused for reduction in income level of the public. It leads reduce in effective demand and the volume of employment.

In the point view of classical group of economists, interest is the reward for “waiting”. But in the point view of Keynes, rate of interest is the reward for parting with liquidity. The classical economists opined that Rate of Interest is determined by the intersection of the saving and investment schedule. The Keynes theory gives us a set of liquidity preference schedules various levels of income.

The classical theory is based on the conception of static economy. Whereas Keyne’s theory is dynamic. Keynes theory is a general theory and as such as a very wide application to all situations – unemployment, partial employment and near full employment.

The classical theory analysis relates only to full employment. The classical economists consider full employment a general feature and unemployment a rare phenomenon. Keynes integrated the theory of money with the theory of value and output.

According to the classical economists, increase in money supply brings about inflation and must, therefore, be avoided, this arose from their convention that allows existed full employment. But Keynes pointed out that full employment was a rare phenomenon, actually there was generally less than full employment so that some productive resources of the community lay idle and unemployed, totally or partially. That being, an increase in money supply would increase employment and output and may not thus necessarily be in inflation.

Thus Keynes’ theory has great relevance to the world reality and has great particular value. Whereas the view of the classical economists are more or less theoretical and devoid of any particular importance.

Short Answer Questions

Write the answers briefly for the following questions.

Question 1.
State the assumptions of the classical theory of Employment.
Answer:
Assumptions of the classical theory of Employment: The classical theory of employment is based on the following assumptions:

  1. There is a free enterprise economy.
  2. The economy operates under conditions of perfect competition.
  3. There is no government interference in the economy, and price mechanism is allowed to work freely.
  4. The equilibriums viewed from the long-term perspective.
  5. It is assumed that all savings are automatically converted into investment.
  6. Both interest rates and wage rates are flexible, adjusting to restore equilibrium.
  7. There are no constraints on market expansion.
  8. Money acts as a medium of exchange and does not influence out and employment.

Question 2.
“Supply creates its own demand. Explain this statement.
Answer:
Jean Baptist Say (1767 – 1832) was a French economist and a business man. He founded the French classical school of Economics. He wrote a book titled “Treatise on Political Economy” in 1803 which became so much famous that it was used as a textbook in American colleges in those days. His writings influenced many countries.

The classical theory of employment is based on the Say’s law of market. The famous law of markets propounded by J.B. Say states that “Supply creates its own demand. ’’This law is generally interpreted as supply always equals demand or it can be expressed as S = D. Whenever additional output is produced in the economy, the factors of production which participate in the process of production, earns income in the form of rent, wages, interest and profit.

The total income so generated is equivalent to the total value of the additional output produced. Such income creates additional demand necessary for the sale of the additional output. Therefore, the question of the additional output not being sold does not arise. It is assumed that the whole income is spent on purchase of commodities, partly on consumption goods and partly on capital goods.

Question 3.
What are the sources of public revenue?
Answer:
Revenue received by the government from different sources is called public revenue. Public revenue is broadly classified into two kinds.

  1. Tax revenue
  2. Non-tax revenue.

1) Tax Revenue: Revenue received through collection of taxes from the public is called tax revenue. Both the Central and State governments collect taxes as per their allocation in the Constitution. Broadly, taxes are divided into two categories.

a) Direct taxes:

  • Taxes on income and expenditure.
    E.g : Personal income tax, corporate tax, interest and expenditure tax.
  • Taxes on property and capital assets.
    E.g : Wealth tax, gift tax, estate duty.

b) Indirect taxes : Taxes levied on goods and services.
Eg : Excise duty, customs duty, service tax.

2) Non-tax Revenue: Government receives revenues from sources other than taxes and such revenue is called the non – tax revenue. The sources of non-tax revenue are as follows.

  1. Administrative revenue: Government receives money for certain administrative services. Ex : License fee, tuition fee, penalty, etc.
  2. Commercial revenue : It is the second important source of public revenue. Modern governments establish public sector units to manufacture certain goods and offer certain services. These goods and services are exchanged for the prices. Government gets revenue from public sector units like IOC, BSNL, Indian Railways, Indian Airways, etc.
  3. Loans and advances When the revenue received by the government from taxes and from the above non – tax sources is not sufficient to meet the needs of government expenditure, it may receive loans from the financial institutions operating within the country and also from the public. The modern governments can also obtain loans from foreign governments and international financial institutions.
  4. Grants-in-aid: Grants are amounts received without any condition of repayment. They are not repaid. State governments receive such grants from the central government. The Central government may receive such grants from foreign governments or any international funding agency. Grants are of two types.

Theory of Employment and Public Finance Questions and Answers AP Inter 1st Year Economics Chapter 9 7

  1. General grants: When a grant is given to meet shortage of funds in general without specifying a purpose, it is called general grant.
  2. Specific grants : When a grant is given for a specific purpose, it is called a specific grant. It cannot be spent on any other purpose.
    E.g : Education grant, Family planning grant, etc.

Question 4.
List out the various items of public expenditure.
Answer:
Public expenditure is an important part of public finance. Modern governments spend money to perform various functions. The expenditure incurred by the government on various economic activities is called the public expenditure. Usually public expenditure will be made on following aspects.

  1. Defence
  2. Internal security (Police)
  3. Economic services (agriculture, industry, power, transport, communication, science and technology, etc.)
  4. Social services (education, health, broadcasting, etc.)
  5. Other general services (organs of state, tax collection, external affairs, etc.)
  6. Pensions
  7. Subsidies
  8. Grants to state governments
  9. Grants to foreign governments
  10. Loans to state governments
  11. Loans to public enterprises
  12. Loans to foreign governments
  13. Repayment of loans (principal amount, interest and debt management)
  14. Assistance to states on natural calamities, etc.
  15. Expenditure made for day to day administration

Public expenditure transfers money to the community. The income of the society increases on account of the increase in public expenditure. Development may take place.

Question 5.
Write a note on Goods and Services Tax (GST).
Answer:
Goods and Services Tax (GST) is a comprehensive, multistage, destination-based value-added tax levied on the supply of goods and services for domestic consumption in India. It was introduced on July 1, 2017. GST replaced multiple indirect taxes like excise duty, VAT, and service tax, aiming to create a unified tax system under the slogan One Nation, One Tax.

GST operates under a dual structure – Central GST (CGST) and State GST (SGST) – for intrastate transactions, and integrated GST (IGST) for interstate transactions. The tax is collected at every stage of the supply chain, but businesses can claim input tax credit for taxes paid on inputs, ensuring only the value added at each stage is taxed and eliminating the cascading effect of taxes.

This reform has simplified tax administration, improved compliance and fostered a seamless national market, making Indian industry more competitive and transparent.

Question 6.
Distinguish between Revenue account and Capital account in the Budget.
Answer:
Here is a comparison between the revenue accounts and the capital account in the budget.

CriteriaRevenue AccountCapital Account
DefinitionDeals with day-to-day operational expenses and recurring income.Deals with long-term investments and creation of assets.
ReceiptsRevenue receipts (eg. Taxes, fees, interest)Capital receipts (eg. Loans, sale of assets, disinvestment).
ExpenditureRecurring expenses (eg. salaries, subsidies, maintenance)Non-recurring assets-creating expenses (eg. Infrastructure, loans to states.
Impact on Assets or LiabilitiesNo change in assets or liabilities, only affects current year incomne/expense.Leads to creation of assets or reduction or increase in liabilities.
NatureShort – term recurringLong-term non-recurring.
ExamplesSalaries, pensions, subsidies, healthcare.Roads, bridges, hospitals, loans.

Question 7.
Explain the Investment multiplier.
Answer:
The concept of the Investment multiplier was introduced by JM. Keynes. The Investment multiplier is an important in Keynesian theory, which explains how an economy’s income and employment are determined.

The multiplier refers to the phenomenon where a change in investment or expenditure lead to a proportionately larger change (or multiple change) in the national income.

Multiplier explains how many times the aggregate income increases as a result of an increase in investment. When the level of investment increases by an amount say ∆I , the equilibrium level of income will increase by some multiple amounts ∆Y.

Thus, the multiplier expresses the relationship between an initial increment in investment and the resulting increase in aggregate income. In other words, the ratio of change in income (∆Y) to change in investment (∆I) is called the investment multiplier.
Thus, k = \(\frac{\Delta \mathrm{Y}}{\Delta \mathrm{I}}\)
Where, k = Multiplier,
∆Y = Change in Income,
∆I = Change in Investment.

Question 8.
Define Foreign Exchange Rate. Explain the types of foreign exchange rate.
Answer:
Foreign Exchange Rate : Foreign Exchange (FX) rate is the price of one currency expressed in terms of units of another currency and represents the number of units of one currency that exchanges for a unit of another.

Previously the exchange rate was determined in terms of one major foreign currency such as the US dollar or British pound sterling. As this was causing frequent fluctuations, the concept of basket of currencies was introduced in 1969. Now, the basket includes ‘five currencies’ assigned different weightages.

Types of Exchange rates : There are two major types of exchange rate regimes at the extreme ends, namely

  • Floating (Flexible) exchange rate regime,
  • Fixed (Non-Floating) exchange rate regime.

a) Floating exchange rate regime : Under floating exchange rate regime, the equilibrium value of the exchange rate of a country’s currency is market- determined (i.e. the demajid for and supply of currency relative to other currencies determine the exchange rate).

Under this system, there is no interference on the part of the government or central bank of the country in the determination of exchange rate.

b) Fixed exchange rate regime : Under fixed exchange rate regime, a country’s central bank or government declares the value of its currency relative to another country’s currency or a basket of currencies.
Eg.: Fixing the value of Rs. 85 per US dollar.

In order to maintain the exchange rate at the predetermined level, the central bank intervenes in the foreign exchange market.

Question 9.
Explain the difference between current account and capital account in Balance of Payments.
Answer:

FeatureCurrent AccountCapital Account
DefinitionRecords net income from trade in goods services and transfers.Records net changes in ownership of national assets and liabilities.
Main componentsExports or import of goods and services, income (eg. dividends interest) current transfers (remittances, aid)Foreign direct investment, portfolio investment loans, changes in reserves.
Nature of transactionsReceipts and payments for non capital items (trade, services, income).Sources and uses of capital (investments, loans, asset sales.
Effect on economyAffects net income, employment, and trade balance.Affects country’s foreign assets / liabilities and investment flows.
Example transactionsExport of cars, import of oil, remittances sent home.FDI in a factory, purchase of foreign stock government borrowing abroad.
Formula (simplified)Current Account = (Exports – Imports) + Net Income + Net current Transfers.Capital Account = Change in foreign ownership of Domestic Assets -Change in domestic ownership of Foreign Assets.

Question 10.
Explain the criticism against the classical theory of employment.
Answer:
J.M. Keynes criticized, the basic assumptions of classical theory. According to him, the assumptions of classical theory are far from reality. The main points of criticism are as follows.

  1. The assumption of full employment is unrealistic. It is a rare phenomenon and not a normal feature.
  2. The wage cut policy is not a practical policy in the modern times. The supply of labour is a function of money wage and not real wage. Trade unions would never accept and reduction in the money wage rate.
  3. Equilibrium between savings and investment is not brought about by a flexible rate of interest. In fact, saving is a function of income and not of interest.
  4. Classical economists believe that the economic forces automatically adjust by themselves without interference of government. But automatic adjustment mechanism failed to restore full employment during the period of economic depression in 1930.
  5. The long-run approach to the problem of unemployment is also not realistic. Keynes commented, “We are all dead in the long run”. He considered unemployment is a short-run problem.
  6. J.M. Keynes dissolved the classical assumption that “Money is neutral”. He integrated monetary variables with real variables through rate of interest and successfully demonstrated effect of change in money supply in the real variables.

Question 11.
Distinguish between aggregate supply price and aggregate demand price.
Answer:
Aggregate Supply: Aggregate supply refers to the total supply of goods and services in the economy. The level of aggregate supply depends on the level of employment. The minimum amount of money which the producers in the economy must receive by selling the goods and services at different levels of employment is called aggregate supply price. As the level of output increases with the level of employment the aggregate supply price also increases with every increase in the level of employment.

Aggregate Supply Schedule: It shows the various amounts of supply at different levels of employment. It is shown in the table given below.

Level of employment
(in lakhs of workers)
Aggregate supply price
(in crore of rupees)
10500
11550
12600
13650
14700
15750
16800

From the above table, we know that as employment increases aggregate supply is increasing. So there is a direct relationship between level of employment and aggregate supply.

Aggregate Supply Curve: If the above schedule is shown in graph, then we get a curve. This curve is called aggregate supply curve.

Aggregate supply curve can be seen sloping upwards from left to right. It started from the origin which means the aggregated supply is zero, when the employment is nil.
Theory of Employment and Public Finance Questions and Answers AP Inter 1st Year Economics Chapter 9 8

In the above diagram as employment levels Aggregate Supply Function increase the AS curve rises to the right. ON is assumed to be full employment level. At this level, aggregate supply the function AS is parallel to Y – axis which means that the aggregated supply is perfectly inelastic.

Aggregate Demand : Aggregate demand means the total demand for all commodities in the economy at a particular level of employment. The amount they spend on consumption goods is called consumption expenditure (C) and their expenditure on capital goods is called investment (I). The entrepreneurs expect that the community as a whole is willing to spend certain amount towards purchase of the total output. That expected expenditure is termed as aggregate demand price.

Aggregate Demand Schedule: It shows the aggregate demand at different levels of employment. As the level of employment rises, the total income of the community also rises and therefore the aggregate demand price also increases. This can be seen in the following table.

Aggregate Demand Function

Level of employment
(in lakhs of workers)
Aggregate demand price
(in crore of rupees)
10600
11625
12650
13675
14700
15725
16750

In the above table, as employment increases AD also increases. So there is direct relationship between levels of employment and aggregate demand.

Aggregate Demand Curve : If the AD schedule is shown on a graph, then we get a curve. This curve is called aggregate demand curve. This is shown in the diagram given adjacent:
Theory of Employment and Public Finance Questions and Answers AP Inter 1st Year Economics Chapter 9 9

In the adjacent diagram, AD curve is the aggregate demand curve. It slopes upwards from left to right.

Question 12.
Explain the concept of Effective Demand.
Answer:
Effective Demand : The level of employment will be in equilibrium at a point where aggregate demand and aggregate supply are equal. The aggregate demand at which it is equal to aggregate supply is called effective demand. This is shown in the table given below.

Effective Demand

Levels of employment
(in lakhs of workers)
Aggregate supply price
(in crores of rupees)
Aggregate demand price
(in crores of rupees)
10500600
11550625
12600650
13650675
14700700
15750725
16800750

In the above table, at the employment of 14 lakhs, the aggregate supply and aggregate demand are equal. At the level of employment of below 14 lakhs, aggregate supply is less than aggregate demand. Similarly, at the level of employment of above 14 lakhs aggregate supply is more than aggregate demand. Only at the level of 14 lakhs the A.D and AS are equal. Hence, it is called effective demand.
Theory of Employment and Public Finance Questions and Answers AP Inter 1st Year Economics Chapter 9 10

In this diagram, Aggregate demand price curve (AD) and aggregate supply price curve (AS) intersect each’other at point E1”. It shows the equilibrium point. The equilibrium has been attained at “ON,”, level of employment. It is assumed that “ON1” in the above diagram does not indicate full employment as the economy is having idle factors of production. So it is considered as under- employment equilibrium.

According to Keynes, to achieve full employment an upward shift of aggregate demand curve is required. This can be possible through government expenditure on goods and services supplied in the economy, whenever private entrepreneurs may not show interest to invest. With this the AD1 curve (C + I) shifts as AD2 (C + I + G) at new point of effective demand E2, where the economy reaches full employment level i.e., ONF.

Question 13.
Explain the objectives of Government Budget.
Answer:
Objectives of Government Budget : The government plays a crucial role in promoting public welfare. To achieve this, it intervenes in the economy through the following three essential functions. They are:

1. Reallocation Function:
Under the budgetary policy, the government aims to reallocate resources in line with the economic (profit maximization) and social benefit (public welfare) priorities of the country. For example, Government discourages the production of harmful consumption goods (like liquor, cigarettes, etc.) through heavy taxes and encourages the use of “khadi products” by providing subsidies.

2. Redistribution Function :
Economic inequality is an inherent part of every economic system. The government aims to reduce such inequalities of income and wealth through its budgetary policy. Fiscal instruments like taxation, subsidies, expenditure on social security and public works are used by the government to achieve this objective.

3. Stabilization Function:
The government budget is used to prevent business fluctuations of inflation (or) deflation and to maintain economic stability. The Government aims to control the different phases of business fluctuations, with the help of budgetary policy. Policies of surplus budget during inflation and deficit budget during deflation are adopted to achieve stability in the economy.

Question 14.
Write the types of budget.
Answer:
There are three types of budget based on the difference between the receipts and expenditure:

  1. Surplus Budget : This refers to a budget in which the total revenue is more than the total expenditure.
  2. Balanced Budget: This refers to a budget in which the total expenditure and the total revenue are equal.
  3. Deficit Budget: This refers to a budget in which the total expenditure exceeds the total revenue.

Theory of Employment and Public Finance Questions and Answers AP Inter 1st Year Economics Chapter 9

Question 15.
Explain different types of deficit.
Answer:
Generally speaking, budget deficit arises when the total expenditure in the budget exceeds the total-receipts.

a) Revenue Deficit Revenue Deficit arises when revenue expenditure exceeds revenue receipts.
Revenue Deficit = Revenue receipts – Revenue expenditure

b) Capital Deficit Capital deficit occurs when capital expenditure exceeds capital receipts.
Capital Deficit = Capital receipts – Capital expenditure

c) Budget deficit Budget deficit is the difference between the total receipts and the total expenditure. In other words, it is the sum of Revenue Deficit and Capital Deficit.
Budget Deficit = Total Receipts – Total Expenditure (OR)
Budget Deficit = Revenue Deficit + Capital Deficit

d) Fiscal deficit: Fiscal Deficit is the difference between Government’s total expenditure and its total receipts (revenue and capital), excluding borrowings and other liabilities. In other words, Fiscal Deficit is the sum of budget deficit and market borrowings and other liabilities.
Fiscal deficit = Revenue Receipts + Capital Receipts (excluding borrowings and other liabilities) – Total expenditure. (OR)
Fiscal Deficit = Budget Deficit + Market borrowings and other liabilities

e) Primary deficit: The primary deficit is derived by subtracting interest payments from the fiscal deficit.
Primary Deficit = Fiscal deficit – Interest payments

Question 16.
Write the objectives of FRBMA.
Answer:
The enactment of the FRBMA, in August 2003, marked a turning point in fiscal reforms, binding the government through an institutional framework to pursue a prudent fiscal policy.

Main objectives :

  1. The Act mandates the central government to take appropriate measures to reduce fiscal deficit to not more than 3 percent of GDP and to eliminate the revenue deficit by March 31, 2009. This deadline was later extended to 2021. However, the target is yet to be achieved.
  2. It requires a reduction in the fiscal deficit by 0.3 per cent of GDP each year and the revenue deficit by 0.5 per cent.
  3. The Act also requires the debt of central government to be limited to 40% of GDP by 2024-25.

Very Short Answer Questions

Question 1.
Laissez Faire.
Answer:
According to classical the role of government in economic activities should be nominal or very less. The free play of economic forces itself brings about the fuller utilization of economic resources including labour. Any interference with the free play of market force, Say’s theory shall fail to bring about full employment.

Question 2.
Say’s Law of Markets.
Answer:
J.B. Say, French economist advocated the famous “Law of markets” on which the classical theory of employment is based. According to this law “Supply creates its own demand’’. According to this law, whenever additional output is created, the factors of production which participate in that production receive incomes equal to that value of that output.

Question 3.
Consumption function.
Answer:
Consumption is a function of income, denoted as C = f(Y) (where C is consumption and Y is income). It means consumption depends on the level of income. As income rises, consumption also increases but not in the same proportion. The increase in consumption is usually less than the increase in income. It is because of the propensity to consume. It means the tendency on the part of the consumers to spend their income. It depends upon several factors.

Question 4.
Marginal Propensity to Save.
Answer:
In Keynesian economic theory, Marginal Propensity to Save (MPS) refers to the proportion of an aggregate raise in income that a consumer saves rather than spends on the consumption of goods and services. Put differently MPS is the proportion of each added dollar of income that is saved rather than spent, MPS is a component of Keynesian macroeconomics theory and is calculated as the change in savings divided by the change in income.

MPS = Change in Saving = Change in Income

Question 5.
Paradox Thrift.
Answer:
The paradox of thrift was developed by British economist J.M. Keynes and popularized in his book The General Theory of Employment, Interest and Money.

If all the people of the economy increase the proportion of income they save (ie., if the MPS of the economy increases) the total value of savings in the economy will not increase – it will either decline or remain unchanged. This result is known as the Paradox of Thrift. This theory states that as people become more thrifty, overall savings may actually decline or remain unchanged.

Question 6.
Goods and Services Tax.
Answer:
Goods and Services Tax is the biggest tax reform in the country since Independence. GST was introduced in India on 1st July 2017. The motto of the GST is One Nation, One Tax, One Market, it is applicable throughout the country with one rate for one type of goods or services. GST replaced large number of taxes on goods and services levied by central and state/UT Governments, Some of the major taxes like excise duty, service tax, central sales tax, VAT etc. are replaced by GST.

Question 7.
Marginal propensity to consume.
Answer:
It refers to the ratio of change in consumption expenditure to the change in the income.
MPC = \(\frac{\Delta C}{\Delta Y}\)
∆C = Change in consumption
∆Y = Change in income
If the MPC increase, consumption increases more and aggregate demand can be increased.

Question 8.
Effective Demand.
Answer:
Effective demand is that aggregate demand which becomes equal to the aggregate supply. This refers to the aggregate demand at equilibrium.

Question 9.
Deficit Budget.
Answer:
Deficit budget refers to the budget in which the total expenditure exceeds the total revenue.

Question 10.
Fiscal Deficit.
Answer:
Fiscal deficit is the difference between the total expenditure and the total revenue minus the market borrowings. In other words, fiscal deficit is the budget deficit plus the market borrowings and other liabilities.

Fiscal deficit = (Total revenue – Total expenditure) + market borrowings & other liabilities, (or)
Fiscal deficit = Budget deficit + market borrowings and other liabilities.

Theory of Employment and Public Finance Questions and Answers AP Inter 1st Year Economics Chapter 9

Question 11.
FRBM Act.
Answer:
The FRBM Bill was introduced in the parliament of India in the year 2000 by Atal Bihari Vajpayee Government to provide legal backing to the fiscal discipline to be institutionalized in the country. Subsequently, the FRBM Act was passed in the year 2003. It is an act of the parliament that sets targets for the government of India to establish financial discipline, improve the management of public funds, strengthen fiscal prudence, and reduce its fiscal deficits.

Question 12.
Fiscal Deficit Balance of Trade and Balance of Payments.
Answer:
Balance of Trade (BoT) is a statement showing the total value of exports and imports of goods over a specific period of time. Invisible items i.e., services are not included in BoT.

The BoP (Balance of Payment) is a systematic record of all economic transactions between the residents of one country and the residents of the rest of the world in a year. The BoT always balance in an accounting sense.

One Word Answer Questions

Answer the following questions in ONE WORD.

Question 1.
In which year, Goods and Services Taxes (GST) was introduced in India ?
Answer:
1.7.2017

Question 2.
The ratio of change in consumption to the change in Income is known as
Answer:
Marginal Propensity to Consume (MPC)

Question 3.
“Supply creates its own demand”, stand by ?
Answer:
J.B.Say

Question 4.
The slope of consumption function is equal to :
Answer:
MPC – Marginal Propensity to Consume)

Fill in the blanks

Question 1.
The minimal interference of the government in economic activities is known as ____________.
Answer:
Laissez Faire

Question 2.
In ____________ budget, the total receipt and total expenditure are equal.
Answer:
Balance Budget

Question 3.
The ratio of change in Income to change in investment is called ____________.
Answer:
Investment Multiplier

Question 4.
Fiscal deficit minus interest payments is equal to ____________.
Answer:
Primary Deficit

Question 5.
If borrowings and other liabilities are added to the budget deficit, we get ____________.
Answer:
Fiscal Deficit

Multiple Choice Questions

Question 1.
Which of the following is not an assumption of classical theory of employment?
1) Full employment
2) Laisswez faire employment
3) Perfect competition
4) Short period
Answer:
4) Short period

Question 2.
A point where aggregate demand equals to aggregate supply is called :
1) Direct Demand
2) Indirect demand
3) Effective Demand
4) Derived Demand
Answer:
3) Effective Demand

Question 3.
Which of the following is not considered as public revenue?
1) Direct Taxes
2) Indirect Taxes
3) Goods and Services Tax
4) Transfer Payments
Answer:
3) Goods and Services Tax

Theory of Employment and Public Finance Questions and Answers AP Inter 1st Year Economics Chapter 9

Question 4.
If revenue receipts are Rs. 800 cr. capital receipts Rs. 500 cr. borrowings and other liabilities are Rs.400 and total expenditure is Rs.1200 cr. the fiscal deficit is
1) Rs. 1200 cr.
2) Rs. 500 cr.
3) Rs. 300 cr.
4) Rs. 400 cr.
Answer:
3) Rs. 300 cr.

Question 5.
GST comes under which type of tax in the government budget ?
1) Indirect tax
2) Corporate Tax
3) Direct Tax
4) Income Tax
Answer:
1) Indirect tax
National Income Accounting Questions and Answers AP Inter 1st Year Economics Chapter 8

Regular practice with AP Inter 1st Year Economics Study Material Chapter 8 National Income Accounting Questions and Answers helps students stay prepared for examinations.

AP Inter 1st Year Economics 8th Lesson National Income Accounting Questions and Answers

Essay Questions

Write an essay on the following questions.

Question 1.
Describe the components of National Income.
Answer:
In Macro Economics, national income plays an important role. For the economic development of a country, the national income estimates are very important.

The total market value of all goods and services produced in a country during a given period of time is called national income.

Definition : According to Marshall, “Labour and capital of a country, acting on its natural resources produce annually a certain net aggregate of commodities material and immaterial, including services of all kinds” is called National Income.

Components of national income : There are five main components of national income.
They are ;
a) Consumption – C
b) Gross domestic investment – I
c) Government expenditure – G
d) Net foreign investment – (x – m)
e) Net income from abroad

a) Consumption – C : It is the total expenditure made by households on goods and services. It includes both durable and non-durable goods like food grains, clothing, medical services, etc. The level of consumption depends on the level of incomes.

b) Investment – I : It is the expenditure by firms on goods and services which are not for current consumption. It includes expenditure on capital like machinery, roadways, bridges, etc. which will help in production of consumer goods in future.

c) Government expenditure (G) : It is the expenditure made by the government on infrastructural facilities for the use of the society. It also includes government expenditure on services like Police, Military and Judicial services.

d) Net foreign investment (x – m) : It is the income earned by a country through international trade. Every country exports certain volume of goods produced by it and imports goods which are relatively cheaper in the international market or other countries.

The difference between the value of exports and imports (either positive or negative) has to be taken into account to estimate the national income of a country.

The net foreign investment depends on the export – import policy of the government and the comparative price level of the goods in domestic and international markets.
Y = C + I + G + (x – m)

e) Net income from abroad : Some of the nationals of a country working in other countries may be sending remittances to their country. Likewise foreigners in one country may be sending their income abroad. Hence net income from abroad represents the difference between receipts and payments of the above type of factor incomes.

Question 2.
Explain various methods of calculations National Income. [March-2026]
Answer:
National Income is the total market value of all goods and services produced in a country during a given period of time.

Measurement of National Income :

There are three methods of measuring National Income.

  1. Output method or Product method
  2. Expenditure method and
  3. Income method.

Cairn Cross says “National Income can be looked in any one of the three ways, as the National Income measured by adding up everybody’s income, by adding up everybody’s output, and by adding up the value of all things that people buy and adding in their savings.”

1) Output method or Product method : It is also known as inventory method or commodity service method. In this method we find the market value of all final goods and services produced in a country during a given period of time. The entire output of final goods and services are multiplied by their respective market prices to find out the gross national product.

NI = (P1Q1, P2Q2 + ………………. PnQn)
= Depreciation – Indirect taxes + Net Income from abroad.
where NI = National Income,
P = Price of the good or service;
Q = Quantity of good or service produced; 1, 2 ………………………. n are the various goods and services produced.

The values of raw material, intermediary goods, etc. should not be included. Only final goods should be taken into account.

Here we find out the value added in the different sectors like agriculture, government professionals, industry and services sectors. Hence it is also called “Value added method”.

National income based on output data is calculated by adding the sum of Values added’ by each firm in each industry. Industrial activity is conventionally classified according to the standard industrial classification.

Value added is the difference between the final value of the product and the cost of the inputs of raw materials and components, i.e., it is the rise in value of the product caused by the activities of the firm itself.

2) Income method: In this method, the incomes earned by all factors of production are aggregated to arrive at the national income of a country. The four factors of production receive incomes in the form of wages, rent, interest and profits. This is also National Income at factor cost.
NI = W + I + R + P + Net income from abroad
NI = National Income.
W = Wages,
I = Interest,
R = Rent,
P = Profits
This method gives us National Income according to distributive shares, (the most important share is that of labour)

Income from employment
+ Income from self employment
+ Gross trading profits of companies
+ Gross trading surpluses of nationalized industries
+ Gross trading surpluses of general government enterprises
+ Rent
+ Imputed charge for the consumption of non-traded capital
= Total domestic income
– Stock appreciation
+ Residual error
= Gross Domestic Product at factor cost

Undistributed profits of companies are included in the accounts as they have been earned in the accounting period. It makes no difference what the firm does with the profits subsequently.

Residual error refers to a sum that is added to balance the accounts. Each approach to calculating national income involves thousands of figures ‘ collected from a variety of sources. It is not surprising that the totals are not, in practice, equal. The residual error appears in the income accounts purely for convenience of presentation.

3) Expenditure method: In this method we add the personal consumption expenditure of households, expenditure of the firms, government purchase of goods and services, net exports plus net income from abroad.

MI = EH + EF + EG + Net exports + Net income from abroad.

Here national income = Private final consumption expenditure + government final consumption expenditure + net domestic capital formation + net exports + net income from abroad
EH = Expenditure of Households
EF = Expenditure of Firms
EG = Expenditure of Government

Care should be taken to include spending or expenditure made on final goods and services only.

There are two different ways in which national income of a country is estimated. They are national income at market prices and national income at constant prices.

Question 3.
Find the GDPMP, GNPMP and GNPFC from the following data on the economy.

ItemsAmount (in Cr.)
1. Value of output in primary sector600
2. Net factor income from abroad30
3. Value of output in tertiary sector900
4. Value of output in secondary sector700
5. Intermediate consumption in tertiary sector300
6. Intermediate consumption in primary sector350
7. Intermediate consumption in secondary sector200
8. Net Indirect taxes10

Answer:
To find the GDPMP and GNPFC from the given data, we will follow these steps.

Step I :
Given Data :
I.

  1. Value of output = 600 cr. Rs.
  2. Secondary Sector = 700 cr. Rs.
  3. Tertiary sector = 900 cr. Rs.

II. Intermediate Consumption

  1. Primary sector = 350 cr. Rs.
  2. Secondary sector = 200 cr. Rs.
  3. Tertiary sector = 300 cr. Rs.

III. Net Factor Income from Abroad

NFIA = 30 cr. Rs.

IV. Net Indirect taxes (NIT) = 10 cr. Rs.

GVAFC for each sector
GVAFC = Value of output – Intermediate consumption

  1. Primary sector = 600 – 350 = 250 cr. Rs.
  2. Secondary sector = 700 – 200 = 500 cr. Rs.
  3. Tertiary sector = 900 – 300 = 600 cr. Rs.

Total GVAFC = 250 + 500 + 600 = 1350 cr. Rs.

Step II :

Calculate GDP at market price (MP)
GDPMP = GVAFC + Net Indirect Taxes
GDPMP = 1350 + 10 = 1360 cr. Rs.

Step III :

Calculate GNP at Factor Cost (FC).
GNPFC = GDPMP – NIT + NFIA.
GNPFC = 1360 – 10 + 30 = 1380 cr.Rs.
Alternatively we can also compute it as :
GNPFC = GVAFC + NFIA = 1350 + 30 – 1380 Crs.
So, GDPMP = Rs. 1360 cr. rs.
GNPFC = Rs.1380 cr.rs.

Question 4.
Calculate GDPMP, GNPMP and GNPFC and NNPFC from the following data on the economy.

ItemsAmount (in Cr.)
1. Consumer Expenditure (inclusive of indirect taxes)160
2. Investment40
3. Government Expenditure (inclusive of transfer payments)90
4. Exports30
5. Imports50
6. Net Factor Income from Abroad (NFIA)20
7. Transfer Payments30
8. Net Indirect Taxes40
9. Depreciation10

Answer:

1. Calculate Government Final Consumption (GFCE)
Government expenditure inclusive of transfer payments is given.
To find GFCE, we need to subtract the transfer payments as they are not part of final consumption of goods and services.
GFCE = Government Expenditure inclusive of Transfer Payments – Transfer Payments.
GFCE = 90 – 30 = 60 crore rupees.

2. Calculate GDP at MP (Gross Domestic Product at Market Price)
GDP at MP is calculated using the expenditure method.
GDP at MP = Private Final Consumption Expenditure at MP + Gross Domestic Capital Formation (Investment) + Government Final Consumption Expenditure + (Exports – Imports).
GDPMP = 160 + 40 + 60 +(30 – 50) = 260 – 20 = 240 cr. rs.

3. Calculate GNPMP
GDPMP + NFIA = 240 + 20 = 260 cr. rs.

4. NNPFC = GNPFC – Depreciation
= 220 – 10 = 210 cr. rs.
So, GDPMP = 240 cr. rs.
GNPMP = 260 cr. rs.
GNPFC = 220 cr. rs.
NNPFC = 210 cr. rs.

Question 5.
Define National Income and explain the various concepts of National Income.
Answer:
In Macro Economics, National Income plays an important role. For the economic development of a country, the National Income estimates are very important.

Meaning : National Income is the total market value of all goods and services produced in a country during a given period of time.

Definition : “The labour and capital of a country acting on its natural resources, produce annually a certain net aggregate of commodities, material and immaterial including services of all kinds. This is the net annual income (or) revenue of a country. ”

Concepts of National Income : There are five main concepts of National Income. The various concepts are :

A) Gross National Product (GNP) at Market Prices
B) Gross Domestic Product (GDP) at Market Prices
C) Net National Product (NNP) at Market Prices
D) National Income (or) Net National Product at factor cost
E) Personal Income (PI)
F) Disposable Personal Income (DPI)
G) Per capita Income
H) Relationship between per capita income and population

A) Gross National Product (GNP) at Market Prices: Gross National Product at market prices is the current market value of all final goods and services produced in a country during a given period. The main components of GNP are :

  1. The goods and services purchased by consumers; C
  2. Investments made by public and private sectors; I
  3. Government expenditure on public utility services; G
  4. Incomes earned through International trade; (x – m)
  5. Net factor incomes from abroad.

GNP at market prices = C + I + G + (x – m) + net factor income from abroad. In this concept production of goods and services must be made by the citizens of that country irrespective of where it is produced.

B) Gross Domestic Product (GDP) at Market Prices : This is that part of the GNP that is produced within the country in a given period of time usually a year. In this concept it is essential that production of goods and services must take place within the country, who produces it is not the criterion for computing National Income.

C) Net National Product (NNP) at Market Prices: The country’s stock of fixed capital undergoes certain amount of wear and tear in producing goods and services over a period of time. This \iser cost’ or depreciation or charges for renewals and repairs must be subtracted from the GNP to obtain Net National Product at Market Prices.

NNP at market prices = GNP at market prices – Depreciation.

D) National Income or Net National product at factor cost : It is the total income received by the four factors of production in the form of rent, wages, interest and profits in an economy during a given period of time.

It is also the incomes received by persons supplying the services or resources used in production. It includes all wages earned by employees, interest paid to private individuals, net rent received by landlords and net profit of all kind of business.

The NNP is not available for distribution among the factors of production. The amount of indirect taxes are paid by the firms to the government and not to the factors of production. Similarly the government gives subsidies to firms for production of certain types of goods and services and that part of the production cost is borne by the government.

Hence the goods are sold in the market at a lower price than the actual cost of production. Therefore this volume of subsidies has to be added to the Net National Income.

In modern days the government sector is vastly enlarging and runs several industries and enterprises. The profits of the government do not go to the factors of production.

NI or NNP at factor cost = NNP at market prices – Indirect taxes + Subsidies – Profits of government owned firms.

E) Personal Income (PI) : It is the total incomes received by all persons of households in a country during a given period of time. The whole of NI earned by factors of production is not available to them. Corporate taxes have to be paid by firms before distributing them to share-holders.

Similarly, firms may prefer to keep a part of its profits for expansion or for other exigencies. This part of profits are also not distributed to its shareholders. Salaried employees make contributions for social security.

The government may provide social security allowances like pensions, unemployment allowances, scholarships, etc. These are incomes for some sections of the society even though no productive services are made by them.

Personal Income PI = NI at factor cost – Undistributed profits – Corporate taxes – Social security contributions + Transfer payments.

F) Disposable Personal Income (DPI) Disposable personal income is that part of personal income which is left with the individual after payment of all direct taxes like income tax, property tax, etc. generally disposable income is either spent for consumption or for savings.

DPI = PI – Personal taxes DPI = Consumption + Savings ;

G) Per capita Income : Per capita income is the average income of an individual in a country. It is calculated by dividing national income by population of the country.

Per Capita Income = \(\frac{National Income}{Population}\)

This concept is a good indicator of the average standard of living in a country.

H) Relationship between per capita income and population : There is a close relationship between national income and population. These two together determine the per capita income. If rate of growth of national income is 6% and rate of growth of population is 3%, the rate of growth of per capita income will be 3% and it can be expressed as follows.
QPC = Q – QP
QPC = rate of growth of per capita income
Q = rate of growth of national income
QP = rate of growth of population

National Income Accounting Questions and Answers AP Inter 1st Year Economics Chapter 8

Question 6.
Write the importance of National Income Estimation.
Answer:
The importance of national income studies is growing for several reasons :

  1. The national income estimates or statistics are very important for preparing economic plans.
  2. It is a very important tool for framing economic policies.
  3. It enables us to assess the performance of each sector in the economy.
  4. It is very useful in making budgetary allocations.
  5. It gives us an idea of the standard of living in the country.
  6. It helps us to compare economic growth with other countries.
  7. It gives a clear picture of the level of utilization of natural resources in a country.
  8. It is essential to calculate per capita incomes in a country and income inequalities.
  9. It helps the Government in macroeconomic policy making.
  10. It will enable us to know the role of public and private sectors in the economy.

Short Answer Questions

Write the answers briefly for the following questions.

Question 1.
Explain any four factors that determine National Income.
Answer:
The total market value of all goods and services produced in a country during a given period of time is called National Income.

There are many factors that influence and determine the size of national income in a country. These factors are responsible for the differences in national incomes of various countries.

a) Natural Resources : The availability of natural resources in a country, its climatic conditions, geographical features, fertility of soil, mines and fuel resources, etc. influence the size of National Income.

b) Quality and Quantity of Factors of Production : The National Income of a country is largely influenced by the Quality and Quantity of country’s stock of factors of production.

c) State of Technology : Output and National Income are influenced by the level of technical progress achieved by the country. Advanced techniques of production help in optimum utilization of a country’s national resources.

d) Political Will and Stability: Political will and stability in a country helps in planned economic development and for a faster growth of national income.

Question 2.
Distinguish between GNP and GDP.
Answer:
Differences between GNP and GDP:

Gross National ProductGross Domestic Product
i. The term “National’ refers to normal residents of a country who may be within or outside the domestic territory.i. The term ‘Domestic’ refers to the domestic territory of the country.
ii. GNP is a broader concept than GDP.ii. GDP is a narrower concept than GNP.
iii. GNP includes NFIA such as earnings of Indian corporations in overseas and Indian residents working in overseas.iii. GDP excludes NFIA (Net factor income from abroad).
iv. GNP excludes earnings from current production in India accrue to foreign residents or foreign-owned firms.iv. GDP includes earnings from current production in India that accrue to foreign residents (or) foreign-owned firms.

Question 3.
Suppose the GDPMp of a country in 2023-24 was Rs. 1100 crores, Net Factor Income from Abroad (NFIA) was Rs. 100 Crores, the value of indirect taxes – subsidies were Rs. 150 crores and the value of depreciation was Rs. 200 crores then calculate the NNPFC ?
Answer:
NNPFC = GDP at Market Price – Depreciation + Net Factor Income From Abroad – (Indirect Taxes – Subsidies)
GDPMp = Rs.100 crores
NFIA = Rs. 100 crores
Value of Indirect Taxes – Subsidies = Rs. – 150 crores
Depreciation = Rs – 200 crores
NNPFC = 1100 – 200 + 100 – 150
= 900 + 100 – 150
= 1000 – 150 = 850
∴ NNPFC = Rs.850 crores

Question 4.
Calculate the National income by using the total expenditure approach.

ComponentsAmount (in cr.)
1. Consumption Expenditure500
2. Wages and Salaries400
3. Investment Expenditure080
4. Government Expenditure100
5. Depreciation070
6. Net Factor Income from Abroad050
7. Net Indirect Taxes030
8. Net Exports(- 100)

Answer:
National Income (NDP at MP) = Consumption Expenditure + Investment Expenditure + Government Expenditure + Net Exports.

1. GDPMp = 500 + 80 + 100 + (-100)
= 680 – 100 = 580 cr. rupees

2. NDPMp = GDPMp – Depreciation
= Rs. 580 – 70 = 510 cr. rupees

3. NNPMp = NDPMp + NFIA
= 510 + 50 = 560 cr. rupees

4. NNPFC = NNPMp – Net Indirect Taxes
= 560 – 30 = 530 cr. rupees

Therefore, the national income using the total expenditure approach is Rs.530 crores.

Question 5.
From the following data, compute the Gross National Product at Market Prices (GNPMp) by using value added method.

ItemsAmount (in cr.)
1. Value of output in secondary sector3500
2. Intermediate consumption in primary sector400
3. Value of output in tertiary sector4600
4. Intermediate consumption in secondary sector500
5. Net factor income from abroad(- 200)
6. Value of output in primary sector2000
7. Intermediate consumption in tertiary sector500

Answer:
GVA (Gross Value Added) of Primary Sector = 2000 – 400 = 1,600 crore rupees
GVA of Secondary Sector = 3500 – 500 = 3000 crore rupees
GVA of Tertiary Sector = 460 – 500 = Rs.410 crore Rupees
GDP at Market Price = 160 + 300 + 4,100 = 8,700 crore rupees.
GNPMp = 8700 – 200 = 8,500 crore rupees.

Question 6.
What is National Income at Factor Cost ?
Answer:
National Income at factor cost is the total income received by the four factors of production in the form of rent, wages, interest and profits in an economy during a given period of time. It is also the incomes received by persons supplying the services or resources used in production. It includes all wages earned by employees, interest paid to private individuals, net rent received by landlords and net profits of all kinds of business.

NNP is not available for distribution among the factors of production. The amount of indirect taxes are paid by the firms to the government and not to the factors of production. Similarly, the government gives subsidies to firms for production of certain types of goods and services and that part of the production cost is borne by the government.

Hence, the goods are sold in the market at a lower price than the actual cost of production. Therefore, this volume of subsidies has to be added to the Net National Income.

In modern days, the government sector is vastly enlarging and runs several industries and enterprises. The profits of the government do not go to the factors of production.

NI or NNP at factor cost = NNP at market prices – Indirect taxes + subsidies – profits of government-owned firms.

Question 7.
Write the definitions of National Income.
Answer:
Meaning: National Income is the total market value of all goods and services produced in a country during a given period of time. Several economists have defined National Income as follows :

  1. Fisher’s Definition : “The National Dividend, or Income consists solely of services as received by ultimate consumers, whether from their material or from their human environment.”
  2. Marshall’s Definition : “The labour and capital of country acting on its natural resources, produce annually a certain net aggregate of commodities, material and immaterial including services of all kinds. This is the net annual income or revenue of a country. ”
  3. Kuznet Definition : According to Kuznet, “National Income is the net output of commodities and services flowing during the year from the country’s productive system into the hands of the ultimate consumers or into the net addition to country’s capital goods”.

Question 8.
What is the relationship between per capita income and population?
Answer:
There is a close relationship between national income and population. These two together determine the per capita income. If rate of growth of material income is 6% and the rate of growth of population is 3%, the rate of growth of per capita income will be 3% and it can be expressed as follows.
QPC = Q – QP
QPC = Rate of growth of per capita income
Q = Rate of growth of national income
QP = Rate of growth of population

A rise in the per capita income indicates a rise in standard of living. The rise in per capita income is possible only when the rate of growth of population is less than the rate of growth of the National Income.

National Income Accounting Questions and Answers AP Inter 1st Year Economics Chapter 8

Question 9.
Distinguish between Real GDP and Nominal GDP.
Answer:
Differences between Real GDP and Nominal GDP :

Real GDPNominal GDP
i. GDP in terms of constant prices of a selected base year is termed as real GDP or GDP at constant prices.i. GDP in terms of current market prices is termed as nominal GDP or GDP at current prices.
ii. Real GDP changes only when production changes.ii. Nominal GDP which is essentially a quantity measure is sensitive to changes in the average price level.
iii. The real GDP, when available by industry of origin, gives a measure of the structural changes in the pattern of production in the country which is vital for economic analysis.iii. Nominal GDP refers to rise without any real increase in physical output.

Question 10.
Write the difficulties related to the measurement of National Income.
Answer:
Difficulties related to the measurement of National Income :

  1. Lack of an agreed definition of national income.
  2. Accurate distinction between final goods and intermediate goods.
  3. Issues of transfer payments.
  4. Inadequacy of data and lack of reliability of available data.
  5. Presence of non-monetized sector.
  6. Production for self-consumption, which does not reach markets and therefore not counted.
  7. Absence of recording of incomes due to illiteracy and ignorance.
  8. Lack of proper occupational classification.

Very Short Answer Questions

Question 1.
GNP.
Answer:
Gross National Product at market prices is the current market value of all final goods produced in a country during a given period. The main components of GNP are ;

GNP at market prices = C + I – G + (x – m) + net factor income from abroad.

In this concept production of goods and services must be made by the citizens of that country irrespective of where it is produced.

Question 2.
Per Capita Income.
Answer:
Per capita income is the average income of an individual in a country. It is calculated by dividing national income by population of the country.

Per Capita Income = \(\frac{National Income}{Population}\)

This concept is a good indicator of the average standard of living in a country.

Question 3.
Depreciation.
Answer:
Depreciation is a user cost or replacement cost. The consumption of fixed capital or fall in value of the capital due to wear and tear is called depreciation.

Question 4.
Disposable Income.
Answer:
Disposable income is that part of personal income which is left with the individual after payment of all direct taxes like income tax, property tax, etc. generally disposable income is either spent for consumption or for savings.

Disposable Income (DPI) :
Personal Income – Personal taxes (or) DPI = Consumption + Savings.

Question 5.
Transfer Payments.
Answer:
In National Income Accounting, Transfer payments refer to payments made for which no goods or, services are received in return. They are essentially a redistribution of income and wealth, rather than a payment for current productive activity. These are not included in the calculation of core national income aggregate. The primary reason is to avoid double counting and to accurately reflect the value of current economic production.

Eg: Old age pensions (Social Security),
Unemployment benefits.
Students Scholarships and Grants.

Question 6.
Circular Flow of Income.
Answer:

National Income Accounting Questions and Answers AP Inter 1st Year Economics Chapter 8 1

Question 7.
Net Value Added.
Answer:
Net Value Added (NVA) in National Income accounting defined as the value of output produced by a sector or industry minus the value of intermediate consumption and consumption of fixed capital. Essentially, it measures the net contribution of a production unit to the economy after accounting for the inputs consumed and capital depreciation. It captures the real economic value generated by production activities, including intermediate inputs and capital wear and tear, providing a clearer picture of economic contributing within national income accounting.

Question 8.
CSO definition of National Income.
Answer:
According to the Central Statistical Organization (CSO), ‘National Income’ is the sum total of factor incomes generated by the normal residents of a country in the form of wages, rent, interest and profit in an accounting year.

Question 9.
GDP Deflator.
Answer:
The GDP Deflator is an economic measure that reflects the changes in the price levels of all goods and services produced domestically in an economy over a period, capturing inflation or deflation. It is used to convert nominal GDP, thereby showing how much of the GDP growth is due to price changes rather than the actual output increase.

GDP Deflation = \(\frac{Nominal GDP}{Real GDP}\)

Question 10.
Intermediary consumption.
Answer:
Intermediary consumption consists of the value of the goods and services consumed as inputs by a process of production, excluding fixed assets whose consumption is recorded as consumption of fixed capital, the goods or services may be either transformed or used up by the production processes.

Question 11.
Real GDP.
Answer:
Real GDP is the total value of the goods and services measured at constant prices. Since these prices remain fixed, if the Real GDP changes, we can be sure that it is the volume of production which is undergoing changes.

Question 12.
Production Taxes and Product Taxes.
Answer:
Taxes on Production: Taxes on production are to be paid by a firm by virtue of production of a good or service.
Eg.: registration fee, factory license fee, stamp duties, pollution tax etc. They are unrelated to the quantum of production. It means they do not depend on the actual volume of production.
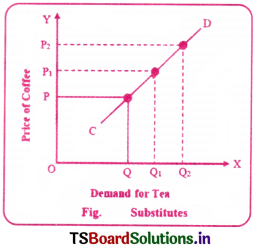
Product Taxes: Product taxes are related to the quantum of production or actual volume of production and are levied by the government on goods and services like excise duties, customs, sales tax, service tax, etc.

National Income Accounting Questions and Answers AP Inter 1st Year Economics Chapter 8

Question 13.
Compute National income from the given table.

ItemsAmount (in cr.)
1. Consumption600
2. Investment200
3. Government Purchases100
4. Exports100
5. Imports200

Answer:
X = C + I + G + (X – M)
C = 600 Crore rupees
I = 200 Crore rupees
G = 100 Crore rupees
X = 100 Crore rupees
M = 200 Crore rupees
Y = 600 + 200 + 100 + (100 – 200)
= 900 – 100
= 800 Crore rupees
So the National Income is 800 crore rupees.

One Word Answer Questions

Answer the following questions in ONE WORD.

Question 1.
The sum of Gross Domestic Product and net Factor Income from abroad is equal to:
Answer:
GNPMP

Question 2.
GDPFC minus Depreciation is equal to:
Answer:
NDPFC

Question 3.
The difference between GNPMP and NNPMP is equal to:
Answer:
Depreciation

Question 4.
GDP Deflator is equal to:
Answer:
\(\frac{Nominal GDP}{Real GDP}\) × 100

Question 5.
GVAMP minus Net Product Taxes is equal to:
Answer:
GVA at basic prices

Fill in the blanks

Question 1.
Prabhas working in Australia and sends money to his parents in India. Which concept of national income covers this item _____________.
Answer:
GNPMP

Question 2.
The goods and services produced within the boundaries of the country are known as _____________.
Answer:
Gross domestic Product

Question 3.
The market value of a rice is Rs. 40/- kg. But in PDS system, the government is charged Re. 1/ – i.e., the government is bearing Rs.39/- kg. This type of government expenditure is own as _____________.
Answer:
Subsidies

Question 4.
The main difference between NNPMP and NNPFC is equal to _____________.
Answer:
Net Indirect Taxes (NIT)

National Income Accounting Questions and Answers AP Inter 1st Year Economics Chapter 8

Question 5.
In India, National Income is calculated in _____________ and _____________ methods.
Answer:
Output, Income

Multiple Choice Questions

Question 1.
NNPMp is equal to :
1) GDPmp-D
2) GNPMp – D
3) GDPMp – D + NFIA
4) Both 2 & 3
Answer:
4) Both 2 & 3

Question 2.
The difference between GNPMp and GDPM is equals to:
1) Net domestic investment
2) Gross foreign investment
3) Gross factor income from abroad
4) Net factor income from abroad
Answer:
4) Net factor income from abroad

Question 3.
The difference between indirect taxes and subsidies:
1) Gross subsidies
2) Gross indirect taxes
3) Net indirect taxes
4) Net exports
Answer:
3) Net indirect taxes

Question 4.
Which of the following is not correct?
1) GDP Mp= C + I + G + (X-M)
2) GNPMp = C + I + G + (X-M) + NFIA
3) NNPMp = C + I + G + (X-M) + NFIA – D
4) NNP = C + I + G + (X-M) + NFIA – D + I.T – S
Answer:
4) NNP = C + I + G + (X-M) + NFIA – D + I.T – S

Question 5.
If Nominal GDP = Rs. 1000, Real GDP = Rs. 500, then GDP Deflator is equal to (in cr.):
1) 1000
2) 500
3) 1500
4) 200
Answer:
4) 200

Theory of Distribution Questions and Answers AP Inter 1st Year Economics Chapter 7

Regular practice with AP Inter 1st Year Economics Study Material Chapter 7 Theory of Distribution Questions and Answers helps students stay prepared for examinations.

AP Inter 1st Year Economics 7th Lesson Theory of Distribution Questions and Answers

Essay Questions

Write an essay on the following questions.

Question 1.
Explain the marginal productivity theory of distribution.
Answer:
This theory was introduced by Prof. David Ricardo but was later developed by J.B. Clark. According to this theory, the price of a factor of production is determined by its marginal productivity. Productivity refers to the quantity of output produced by the use of the factor or factor of production. When a worker produces 10 units in a day, productivity of that worker is 10 units.

Marginal Productivity: Marginal productivity or marginal product means the increase in the total output when one more unit of a factor (labour) is employed, keeping the other factors constant.
E.g : 10 workers can produce 50 pens in a day 11 workers are producing 52 pens. So, the marginal product of the 11th worker is 2 pens because the quantity of pens has increased from 50 to 52 when the 11th worker is employed. If the price of each pen is Rs.5 in the market, the value of the additional pens (output) produced by 11th worker is Rs. 10. So, the increase in the total value of pens by Rs. 10 is also called marginal revenue product or marginal value product.

Assumptions of the theory : The theory is based on the following assumptions:

  1. There is full employment of factors of production.
  2. Substitution of factors of production for each other is possible.
  3. There is perfect competition both in product market and in factor markets.
  4. There is perfect mobility of factors of production.
  5. The firm employs the factor till its price becomes equal to its marginal productivity.
  6. The marginal productivity of an individual factor can be measured.

“Under static conditions every factor including entrepreneur would get a remuneration equal to its Marginal Product or Marginal Value/Revenue Product” – J.B. Clark

This theory states that the price or remuneration of each factor of production is determined basing on its marginal productivity. Factors having higher marginal productivity can get higher price/reward than factors having lower marginal productivity. In other words, the reward or price of any factor of production is equal to its Marginal Revenue Product (MRP) or Marginal Value Product (MVP).

The law can be explained with the following diagram.

Theory of Distribution Questions and Answers AP Inter 1st Year Economics Chapter 7 1

In the adjacent diagram the firm employee OL quantity/number of workers. This is because, when the firm employs or uses OL quantity of labour/workers, wage rate OP is equal to Marginal Revenue S- Product of OL workers.

If the firm uses/employs less than OL quantity of labour (i.e., OL1 workers), Marginal Revenue Product (MRP) of OL1 workers is higher (E1L1) than the Wage Rate (OP). This means the employment of more workers up to OL, add to the revenue and profits of the entrepreneur.

If the firm employs more than OL, quantity of workers (i.e., OL2 workers), the Marginal Revenue Product of (MRP) of OL1 workers (E2L2) is less than the Wage Rate OP. It means, that the employment of more workers than OL adds more to the cost of the firm than to the revenue firm. Hence, the firm employs/uses that quantity of factors/workers where the, MRP of factor is equal to its price/reward.

Question 2.
Define rent and explain the Ricardian theory of rent.
Answer:
Generally rent refers to the remuneration or price paid for the use of durable goods for some period of time like a car, cycle, etc. In Economics, rent refers to the reward/ price paid to the factor of production land, for its services.

Ricardian theory of rent / Classical economic rent: According to David Ricardo, rent is the price paid for the use of land or for free gifts of nature. He defines rent as follows:

“Rent is that portion of the produce of the earth which is paid by tenant for using the original and indestructible powers of soil.”

According to David Ricardo, rent is “differential surplus” earned by more fertile lands in comparison with less fertile land. He feels that rent arises because of differences in the fertility of soils or lands.

Prof. Ricardo explained the concept of rent with the help of an example: A new island is discovered and people have migrated to that place. The first batch of people cultivate A-grade land which is highly fertile. The expenses of cultivation on that land are Rs. 300. The yield on this type of land is 20 quintals of paddy. So, the average cost per quintal is Rs. 15. To cover the expenses of agriculture (cultivation) paddy is to be sold in the market at Rs. 15 per quintal. So there is no rent for this land because the cost of cultivation is equal to the revenue obtained from the sale of the output.

Another batch of people comes to that area and start cultivating B-grade land which is less fertile than A-grade land. For this land also, the expenses of cultivation are Rs. 300 but this land gives only 15 quintals of paddy. To recover cost of cultivation, paddy received from this land is to be sold at Rs. 20 per quintal. The increase in this demand for paddy raises its price to Rs. 20 per quintal. So, the sale price of paddy in the market received from A-grade land and B-grade land (20 +15 quintals) will be Rs. 20 uniformly per quintal. So, now A-grade land will have surplus rent of 5 quintals of paddy, having a value of Rs. 100. In this way, if only A-grade land is cultivated, there is no rent on it. Rent on A-grade land arises only when B-grade land is also cultivated.

After some time, C-grade land is cultivated by new batch of people. C-grade land is less fertile than B-grade land. The expenses of cultivation on this land are also Rs. 300 but this land gives only 10 quintals of paddy. The average cost per quintal is Rs. 30. To recover the cost of cultivation of this land, paddy is to be sold in the market per Rs. 30 per quintal. The increase in the demand for paddy further increases price of paddy to Rs. 30. So, at the market price of Rs. 30 per quintal B-grade land will have a surplus or rent of 5 quintals and its value is 150. The rent or surplus on A-grade land has increased from 5 quintals to 10 quintals, land value from Rs. 100 to Rs. 300.

This theory can be explained with the help of following table and diagram.

Table
Type of
Land
Cost of
Production
Produce
(Quintals)
Rent or Differential Surplus
in Physical
Units
   In Value
Form (Rs.)
A3002010300
B300155150
C3001000

Economic Rent = Value of agricultural produce – Cost of cultivation

The shaded area represents the rent or differential surplus.

The above table clearly shows that when less fertile lands, B-grade and C-grade, are cultivated the rent or differential surplus of more fertile lands increases. According to David Ricardo, fertile lands will not have rent if less fertile lands are not cultivated. Lands which are not having rent or differential surplus are known as “Marginal Land”!

Theory of Distribution Questions and Answers AP Inter 1st Year Economics Chapter 7 2

Assumptions of the Law:

  1. Land is a free gift of nature and has no cost of production. .
  2. Supply of land is absolutely fixed or the supply of land is perfectly inelastic.
  3. Land has original and indestructible powers.
  4. Land has only single use, i.e. cultivation of crops.
  5. Land is heterogeneous, which means lands differ in fertility.
  6. When used for agriculture, land is subject to the law of diminishing returns.
  7. Last grade of land, which does not have rent is called Marginal Land.

Question 3.
What is meant by wages? Briefly explain the various theories of wages.
Answer:
In Economics, the term wage refers to the reward paid to the factor of production, labour for its services. In other words, it is price or reward paid to labour to its services, whether physical or mental.

According to Benham, wage can be defined as “the sum of money paid under contract by an employer to a worker, for the services rendered.”

Theories of Wages:

1) Subsistence Theory of Wages :
This theory was developed by a group of French economists, known as Physiocrats. According to them, wage rate should always be equal to subsistence wage.

Subsistence wage is that amount of wage which enables the worker and his family to satisfy the basic or minimum requirements of life like food, clothing, shelter, etc.

According to Physiocrats, if the actual wage rate is above the subsistence wage rate, workers are encouraged to get married and to have more number of children. So, the supply of labour increases which results in a fall in the actual wage / market wage rate to subsistence level.

On the other hand, if the actual wage in the labour market is below the Subsistence Wage Rate, workers are discouraged to get married. In addition, there will be starvation and diseases in labour families. All these will result in a decrease in labour supply. The fall in the supply of labour in labour market will push up the actual wage to the subsistence level.

In the nutshell, the theory states that wage rates should always be at the subsistence wage level.

2) Wage Fund Theory : This theory was developed by J.S. Mill. According to J.S. Mill, in every organisation, the entrepreneur maintaining (keeps aside) some amount of working capital towards the payment wages. Such amount or fund is known as wage fund.

According to J.S.Mill, wage rate depends on amount of wage fund (which cannot be increased in the short run) and quantity or supply of labour. According to him, wage rate can increase if there is, either an increase in the wage fund or fall in the supply of labour.

Wage Rate = \(\frac{Amount of wage fund}{Number or quantity of labour}\)

According to this theory, wage rates are inversely related to the supply of labour and directly to the amount of wage fund.

3) Residual Claimant Theory of Wages:
This theory was introduced by Prof. Walker. According to Prof. Walker, among the four factors of production, worker is the residual claimant. According to this theory, worker gets as his wages whatever residue or balance is left out, after making payments to land, capital and entrepreneur (in the form of rent, interest, profit) from the sale value (sales revenue) of the goods sold.

Wages = Total Sales Revenue – (Rent + Interest + Profit)

4) Taussig’s Theory of Wages:
This is a revised or modified version of marginal productivity theory. According to Prof. Taussig, the wages of workers are equal to the discounted (value of) marginal product (MRP/MVP) of labour.

Being very poor, workers in general have less waiting capacity. Similarly, there is a lot of time gap between the completion of work / completion of production and sale of the good. Workers expect advance payment of wages to be made before the completion of the sale of goods. For making such advance payment of wages to workers, the employer deducts a certain percentage from the final output (value of the work done by workers) to cover the risk involved in advance payment of wages. Hence, according to Prof. Taussig, wages are equal to the discounted marginal product of labour.

5) Modern Theory of Wages :
This theory was introduced by Alfred Marshall and J.R.Hicks. According to them, price of labour, i.e., the wages of workers, like any other good, are determined by two forces namely, demand for labour and supply of labour.

Demand for labour is dependent on factors like demand for the product to be produced, prices of other supporting factors, technology, etc. Supply of labour depends on factors like size of population, age composition of population, qualifications, level of education, mobility of labour, etc.

According to Marshall and Hicks, wages in factor market or labour market, are determined at that point where demand for labour and supply of labour are equal.

Question 4.
Define interest. Briefly explain the various theories of interest.
Answer:
Interest is the price or reward paid for the use of capital. It is the reward paid to those who save and lend. In other words, it is the share of National Income that goes to the capitalists/capital.

According to Seligman, “Interest is the return from the fund of capital.” According to J.M. Keynes, “Interest is the reward paid to the lender of money for parting with liquidity for the specific period.”

According to Carver, “Interest is the income which goes to capital. ”

Theories of Interest :

1) Abstinence or Waiting Theory of Interest:

This theory was introduced by Nassau Senior. According to him, creation or accumulation of capital is possible only through postponing consumption. It means that savings are possible only through abstaining or refraining from consumption/spending. But abstaining from consumption (not making expenditure) is painful. Similarly, lending of funds or money involves lenders making sacrifices. Hence, interest is the reward for paid to lenders of money for refraining from spending / consumption and for the sacrifices involved in lending.

Marshall has substituted the word “waiting” for abstinence and as such this theory is also known as waiting theory of interest.

2) Agio Theory of Interest or Bohm – Bawerk’s Theory:

The tendency of the people is to prefer present goods/consumption and present enjoyment to future goods and future enjoyment. Savings result in the loss of present goods and present enjoyment. So, interest is the premium or reward on present goods to future goods. Interest is the amount of incentive (reward) paid to the people to induce them to save and lend money and preparing them to have future enjoyment then present enjoyment. In this way, interest is the reward or premium paid for the postponement of present consumption.

3) Productivity Theory of Interest:

This theory is developed by classical economists. According to them, demand for capital arises because capital is productive. According to classical, the productivity of capital rises, up to a certain level, with the use of additional amount of capital. Beyond that level, marginal productivity of capital decreases due to the effect of law of variable proportions. This theory states that rate of interest is just equal to the productivity of capital. So, whenever demand for capital increases, the rate of interest falls or decreases. In other words, the theory states that demand for capital and rate of interest are inversely related.

4) Loanable Fund Theory of Interest :

This theory, a neo-classical theory, was formulated by Knutt Wicksell. According to Wicksell, rate of interest is determined at that point where there is equality (equilibrium) between demand for loanable funds and supply of loanable funds.

On supply side, supply of loanable funds is influenced or determined by factors like savings, dishoarding, bank credit and disinvestment. Higher and larger the savings, dishoarding, bank credit, and disinvestment, larger the supply of loanable funds.

On demand side, demand for loanable funds is determined or influenced by factors like level of investment, level of consumption and demand for hoarding. Higher the demand for funds towards consumption, investment and hoarding, higher the demand for loanable funds.

Supply of loanable funds and rate of interest are inversely related while demand for loanable funds and rate of interest are directly related. This theory states the actual rate of interest , in capital market depends upon demand for loanable funds and supply of loanable funds.

5) Time Preference Theory:

This theory was developed by Irving Fisher. According to Fisher, rate of the interest arises because people have time preference. They prefer present satisfaction to future satisfaction, in view of the future uncertainty and falling value of money. Hence, according to Fisher, interest is the compensation (reward) paid to the people to sacrifice present satisfaction/present enjoyment. If people have more preference to present enjoyment/satisfaction (time preference), higher the compensation/reward they should be offered/paid, in the form of interest.

Fisher states that the degree of time preference depends upon factors like, size of income, distribution of income, the composition of income, certainty of enjoying income in future, temperament and character of the individual.

6) Keynes’ Liquidity Preference Theory:

This theory was developed by J.M. Keynes. According to J.M. Keynes, (the rate of) interest rate is determined by both demand for (liquidity preference) money and supply of money. According to him, Interest is the reward paid for parting with liquidity for the specific period.

On the supply side, supply of money refers to the total money in circulation and is determined by Central Bank (Reserve Bank) of the country. On demand side, demand for money is determined by liquidity preference.

Liquidity preference refers to desire of the people to keep money in the form of liquid cash. Liquidity preference arises because of 3 motives, namely, transactions motive, precautionary motive and speculative money. According to Keynes, liquidity preference and rate of interest are directly related. Supply of money and rate of interest are inversely related.

Question 5.
Explain the difference between risk bearing and uncertainty theories of profit.
Answer:
Risk bearing Theory of Profit :

  1. Proposed by F.B. Hawley, this theory states that profit is the reward for entrepreneurs who bear business risks.
  2. Risks include factors of such a product obsolescence, price fluctuations, competition and natural calamities.
  3. The theory suggests that higher risks lead to higher potential profits, as entrepreneurs must be compensated for the unpleasantness and anxiety of taking risks.
  4. All types of risks are considered, but critics note that many risks (like fire or theft) can be insured and thus do not necessarily lead to profit.

Uncertainty Theory of Profit :

    1. Propounded by Frank H. Knight, this theory distinguishes between risk (which is measurable and insurable) and uncertainty (which is not measurable or insurable).
    2. Knight, economist, argued that profit arises only from bearing uncertainties – unforeseeable, non insurable risks such as unpredictable changes in technology, government policy, or consumer preferences.
    3. Foreseeable risks can be covered by insurance and do not generate profit; only true uncertainties which can not be anticipated or insured against, result is profit for entrepreneurs.
AspectRisk bearing TheoryUncertainty Theory
Main proponentF.W. HawleyFrank H. Knight
Source of ProfitBearing all business risks.Bearing unforseeable, uninsurable uncertainties.
Types of risks consideredAll risks (insurable and uninsurable).Only uncertainties (non-insurable risks).
InsuranceDoes not distinguish between insurable risks.Only non-insurable risks lead to profit.
CriticismToo broad; not all risks lead to profit.More precise; focuses on true entrepreneurial risk.

On the whole, the risk bearing theory sees profit as a reward for taking any business risk, while the uncertainty theory narrows this to profits arising only from bearing unpredictable, non-insurable uncertainties.

Theory of Distribution Questions and Answers AP Inter 1st Year Economics Chapter 7

Question 6.
Explain J. M. Keynes liquidity preference theory of interest.
Answer:
Keynes, in his book “The General Theory of Employment, Interest, and Money,” proposed a monetary explanation of the rate of interest. According to Keynes, interest is determined by both the demand for and the supply of money. According to Keynes “Interest is the reward paid for parting with liquidity for the specified period”.

A. Supply of money: The supply of money refers to the total quantity of money in circulation which is fixed or perfectly inelastic at a given point of time. It is determined by the central bank of a country.

B. Demand for money : The desire to hold ready cash is referred to as liquidity preference. Liquidity preference is negatively related to the rate of interest. People demand money for three primary reasons:

  1. Transactions motive: People’s desire to keep cash for current transactions in personal and business exchanges, considering their level of income and the state of business activity.
  2. Precautionary motive: People keep cash in reserve to meet unforeseen expenses like illness, accidents, and unemployment. Businessmen keep cash in reserve to benefit from unexpected deals in the future, such as purchasing new machines, deal with fire accidents and unexpected needs, etc.,
  3. Speculative motive: The speculative demand for money relates to the desire to hold cash to take advantage of future changes in the rate of interest and bond prices. If bond prices are expected to rise, the rate of interest is expected to fall. As a result, businessmen will buy bonds to sell them when prices rise, and vice versa.

According to Keynes, the rate of interest is determined at point ‘E’ where the demand for money curve intersects the supply of money curve. Hence, the rate of interest is at rx as shown in Fig. The demand for money is inversely related to the rate of interest, meaning that as the interest rate falls, the demand for money increases, and vice versa. Consequently, the demand for money curve slopes downward from left to right. This implies that liquidity preference is inversely related to the rate of interest.

Theory of Distribution Questions and Answers AP Inter 1st Year Economics Chapter 7 3

Question 7.
What is meant by profit? Explain briefly various theories of profit.
Answer:
Generally, the term profit refers to the (surplus of income) difference between total revenue/total income and total cost of production. In Economics, profit is the reward paid/payable to the factor of production, organiser or entrepreneur. It is the reward to the organiser/entrepreneur for the risk and uncertainty borne by him in the form of business and for his entrepreneurial abilities/skills.

Theories of Profits:

1) Dynamic Theory of Profits : This theory is associated with the name of J.B. Clark. According to J.B. Clark, among the four factors of production, organiser / entrepreneur is highly dynamic and profit is the reward paid for his entrepreneurial dynamism.

Being veiy dynamic, entrepreneurs introduce dynamic changes in business like introduction of new products, new production processes, new varieties of products etc. For all such dynamic changes the entrepreneur is paid reward in the form of extra or special profits. Over a period of time, when such dynamic changes are introduced by other sellers also competition among sellers increases. Because of such intense competition in all in the long run, all sellers / firm earn normal profit, the wage of the entrepreneur.

2) Innovation Theory : This theory was developed by Prof. Joseph Schumpeter. According to Schumpeter, profit is the reward paid to entrepreneur for his inventive/ innovation skills.

According to Schumpeter, in a closed capitalist economy, with a stationary equilibrium and with no innovations, prices are equal to cost of production. So, profits do not arise. But the innovations introduced by the entrepreneurs like introduction of new goods, introduction of new methods of production, opening up of or exploring new markets, discovery of new sources of raw materials, etc. result in a wide difference between selling price and cost of production and attractive profits.

In this way, profits, according to Schumpeter, are the reward for innovation and not for risk borne.

3) The Risk Theory of Profit: This theory was proposed by Prof. Hawley. Among the 4 factors of production, entrepreneur is only factor of production who bears the risk in the form of production and sale of goods. He bears various types of risks like fluctuations in future prices, fluctuations in demand, possible entry of new firms sudden change in the taxes of the consumers, etc.

For all such risks taken by entrepreneur, entrepreneur as a factor of production, gets an excess payment (comparatively a higher share in National Income) in the value of goods/output produced. In this way, profit is the reward for the wisely selected business risk taking.

4) Uncertainty Theory of Profit: Prof. Knight developed this theory, which is a slightly modified version of risk theory of profit. In business, there are two types of risks-foreseeable/insurable and unforeseeable/non-insurable risks. Unforeseen and non-insurable risks and uncertainties in business are contingencies like changes in prices, demand, supply, competition from substitutes trade cycles, government interference, etc.

For bearing such uncertainties in business, the entrepreneur should be rewarded in the form of profit. Hence, according to’Prof. Knight, it is not only the entrepreneur who is rewarded in the form of profit, but also his uncertainty bearing abilities.

5) Walker’s Theory of Profit: This theory was developed by Prof. Walker, which is similar to Ricardian theory of rent. According to Walker, capitalists are different from entrepreneurs. He feels that all entrepreneurs are not same, in the sense their managerial / entrepreneurial abilities differ. Some are more efficient whereas some less efficient. According to Walker, only efficient and able entrepreneurs are paid profits.

Similar to Ricardian theory of rent, profits arise as the difference between the output produced by a more efficient firm and the output of a less efficient firm. They are the reward payable to superior managerial ability of the entrepreneur and does not enter the list of production.

Short Answer Questions

Write the answers briefly for the following questions.

Question 1.
What factors determine factor prices?
Answer:
The prices of factor of production like any other good, is determined by its demand and its supply.

On demand side, the price/reward of a factor of production is determined by factors like;

  1. The demand for the goods produced by the factor
  2. Price of that factor of production
  3. Prices of other participating/supporting factors of production
  4. Technological changes.
  5. The stage of returns to scale that apply in production.

On the supply side, the price of factor of production depends on factors like

  1. The size of the population and its age composition.
  2. Mobility of factors of production
  3. Efficiency of factors of production
  4. Geographical conditions
  5. The level of wages in factor / Labour Markets
  6. Income level of the people/ working class.

Question 2.
Explain the concept of quasi-rent with the help of a diagram.
Answer:
Quasi-rent: The concept of quasi-rent was introduced by Prof. Marshall. Quasi-rent means “The additional income derived from machines and other man-made appliances of production in the short-run.”

In the short run, the supply of man-made appliances like ships, trucks, and machines etc., is fixed or inelastic. So, in the short run, when demand for them increases, their income increases and they earn a surplus. Such additional earnings or surplus in the price of such machines, etc. is quasi -rent.

Quasi-rent appears/exists in the short run but disappears in the long run.

Theory of Distribution Questions and Answers AP Inter 1st Year Economics Chapter 7 4

In the above diagram, on X – axis is Quantity of factor of production is shown and on Y-axis rent is shown. In the above diagram, when demand has increased in the short run, rent has increased from OR to ORr But, with the supply of input increasing from OM to OM1 in the long run, the Quasi Rent of RR1 has disappeared and become OR.

Question 3.
Illustrate the concept of scarcity rent with the help of a diagram.
Answer:
The concept of scarcity rent was introduced by Prof. Marshall. According to Marshall, the supply of land is fixed or perfectly inelastic. It cannot be increased. When demand for land increases, the price of land rises. Such additional price or rise in the price of land due to its scarcity is known as scarcity rent. In this way, according to modern economists, rent arises even if all lands are homageneous and also not only to land but also to any other factor of production, if its supply is inelastic.

Theory of Distribution Questions and Answers AP Inter 1st Year Economics Chapter 7 5

In the above diagram, on X-axis, quantity of land is shown. On Y-axis, rent is shown. SL is the line which shows the supply of land, which is perfectly inelastic. DD is the line showing the original demand for land and original rent is OR. When demand for land has increased from DD to D1D1 and D1D1 to D2D2 rent has increased from OR to OR1 and OR1 to OR2.

Question 4.
What is a real wage and what are the factors that determine real wages?
Answer:
The term real wage, refers to the quantity of goods and services that can be purchased with given money wages. It is the money wage expressed in terms of general price level or purchasing power. Real wage is an important concept that determines the standards of living of the people. There is an inverse relationship between real wage and price level.

Determinants of Real Wages :

  1. Purchasing Power of Money: Whether real wage is higher or lower depends upon the purchasing power of money. An increase in the general price level, by lowering the purchasing of money, results in lower real wages and vice-versa.
  2. Method or Form of Payment: If the worker gets additional facilities like free housing, free transport, free medical facilities, etc. along with money wages, his real wage will be higher.
  3. Working Conditions: If workers are having good working conditions like more holidays, less hours of work, etc. their real wages will be higher.
  4. Possibility of Extra Earnings (Subsidiary Earnings) : In some occupations there is possibility or opportunity of having extra earnings. In such occupations, real wages will be higher.
    E.g : Government doctors earning through private practice.
  5. Regularity of Employment: If the employment is regular and permanent, real wage will be higher. But if employment is temporary and irregular, real wage will be lower.
  6. Future Prospects: In jobs where there are better future prospects like promotional opportunities, etc. real wages will be higher.
  7. Nature of Employment: Whether real wage is high or low depends upon the nature of work. If the job is a more dangerous, difficult and involves more risk, real wage will be less.
    E.g Pilots of aeroplanes, mining workers working underground, etc.
  8. Timely Payment: If workers are employed in those organisations where there is regular payment of wages, real wage tends to be high, even though money wages are very low.
  9. Social Prestige: Real wage tends to be very high if a person is employed in a job which carries a lot of social prestige.
    E.g : District Collector, Judge of a High Court, etc.
  10. Period of Education and Educational Expenses: Real wages are also influenced by length of education and amount of educational expenditure. Between two persons receiving the same amount of money wage, real wage of that person tends to be high who is less educated and incurred less expenditure on education.

Question 5.
Explain the concepts of Gross Profit, net profit and their components.
Answer:
Profit is the reward of the factor of production organisation or entrepreneur. It is the reward of the organiser for the risk and uncertainty incurred by him in the form of starting and running of a business.

According to Taussig, “Profit is a mixed and vexed income”. Hawley considers, “profit as a reward for risk bearing”. According to J.B. Clark “Profits are the reward for the dynamic role of entrepreneur”.

According to Prof. Knight, “Profits are the rewards for uncertainty”. There are two important concepts of profits.

1. Gross Profit: Normally, profit means gross profit. It is the difference between (excess of) total revenue and total cost of production.
Components of Gross Profit: Gross profit includes various components as given below.
Implicit rent, implicit wages, implicit interest, normal profit, depreciation charges, windfall gains or profits and net profits.
Gross Profit = Net profit + (Implicit rent + Implicit wage + Implicit interest + Depreciation charges + Insurance premium).

2. Net Profit: Net profit is the economic profit or pure business profit. It is the reward received by the entrepreneur for his entrepreneurial services alone.
Components of Net Profit: Net profit includes the following components. They are:
Reward for coordinating the services of factors of production, Reward for bearing risk and uncertainty, Reward for making innovations, Reward for bargaining the price of factors of production, etc.
Net Profit = Gross profit – (Implicit rent + Implicit wage + Implicit interest + Depreciation charges + Insurance premium).

Question 6.
Explain the concepts of gross interest, net interest and their components.
Answer:
Interest is the price paid for the use of capital. It is the reward paid to those who save and lend. In other words, it is the share of National Income that goes to the capitalists / capital.

According to Seligman, “Interest is the return from the fund of capital”. Keynes considers interest as “Purely monetary phenomenon”. According to him, interest is the “reward paid to the lender of money for parting with liquidity”. There are two types of interests. They are :

  1. Gross Interest,
  2. Net Interest.

1) Gross Interest : Generally, interest means gross interest. It is the actual amount paid by the borrower to the lender as the price or reward for funds borrowed. Gross interest includes not only net interest (price for the use of capital), but also the following elements.

Gross interest = Net interest + Reward for risk taking + Reward for inconvenience + Reward for management.

A) Net Interest : Net interest is the reward for the services of capital alone. Net interest is the interest paid on government bonds and government loans.

B) Reward for Risk Taking: Lending money always involves risk of non – repayment of loan by the borrower. These risks may be trade risks or business risks and personal risks. So, the capitalist charges some extra amount, in addition to the net interest to cover these risks. Greater the risk involved in lending the money, higher will be the rate of interest.

C) Compensation for Inconvenience : Lending of money always involves some inconvenience in making savings. In the same way, the lender may not get back his money when he requires it for his own use. So, the lender charges some extra amount to these inconveniences over and above the net interest. This is included in gross interest.0

D) Rewards for Management Services: A money lender has to incur the expenditure on maintaining records relating to loans, repayments, etc. He has to maintain office and clerical staff. Sometimes, he has to incur legal expenses for the recovery of loans. So, gross interest includes some extra amount to recover all such expenses in addition to other elements.

2) Net Interest : Net interest is the reward for the services of capital alone. It is the interest paid on government bonds and loans. It is the gross interest minus the total of payment for inconvenience, reward for management and insurance against risk.

Net Interest = Gross interest – (Reward for risk taking + Compensation for inconvenience + Reward for management).

Question 7.
Explain the concept of distribution.
Answer:
In Economics, the term distribution (theory of distribution) refers to the pricing of factors of production as well as the distribution of the total national income among the factors of production, which contributed to/made possible the production and National Income.

“Distribution accounts for the sharing of wealth produced by a community among the agents or owners which have been active in its production” – Chapman.

Distribution is of two types namely,

  • Functional Distribution
  • Personal Distribution.

Functional distribution is of 2 types, namely Micro Distribution and Macro Distribution.

Question 8.
Write the assumptions of MPT. (Marginal Productivity Theory).
Answer:
The theory is based on the following assumptions.

  1. There is perfect competition in the factor market.
  2. All the units of a factor are homogeneous and divisible.
  3. The theory assumes full employment of the factors.
  4. There is perfect mobility of the factors of production.
  5. Substitution is possible between the factors.
  6. The marginal productivity of an individual factor is measurable.
  7. The theory is based on the law of variable proportions.
  8. The theory is applicable only in the long run.

Question 9.
Explain the concepts of Productivity and Product.
Answer:
The product can be explained in physical units or monetary units (revenue/ value) as follows:

a) Marginal Physical Product (MPP) : MPP is the additional output obtained by using an additional unit of the factor of production.

MPP = TPPn – TPP(n-1)

b) Marginal Revenue Product (MRP) (or) Marginal Value Product (MVP): MRP is the additional revenue that a firm earns, when it employs an additional unit of the factor in production. It means the increase in the total revenue.

MRP = TRPn – TRP(n-1)

Value of Marginal product (VMP) : It is obtained by multiplying the marginal physical product (MPP) with the price of the product.

MVP or VMP = MPP × P

Under perfect competition, MRP and VMP are equal as the price remains constant. However, under imperfect competition, VMP > MRP.

c) Average Physical Product (APP) : It is the output per unit of factor of production. It is obtained by dividing the total physical product by the number of factor units employed.

APP = \(\frac{TPP}{No. of factor units}\)

d) Average Revenue Product (ARP) : ARP is the revenue per unit of the factor. It can be obtained by dividing the total revenue product by the number of factor units employed.

ARP = \(\frac{TRP}{No. of factor units}\) or APP × P

e) Average Factor Cost (AFC): AFC can be calculated by dividing the total factor cost by the total factor units employed.

f) Marginal Factor Cost (MFC): MFC is the additional cost incurred by employing an additional unit of a factor of production.

Question 10.
Write the criticism of J. B. Clark’s Marginal Productivity Theory.
Answer:

  1. There is no perfect competition in either the factor market or the commodity market.
  2. All the factor units are riot,homogeneous and divisible.
  3. All the factors are not fully employed.
  4. Perfect mobility is not possible for all factors of production.
  5. Substitution is not always possible between the factors.
  6. Marginal productivity is not solely the result of a singular factor alone.
  7. The theory neglects technological progress.
  8. The theory is not applicable in the short run.
  9. This theory considers only demand for a factor and ignores its supply.

Question 11.
Discuss briefly the assumptions of Ricardian Theory of Rent.
Answer:

  1. Land is a natural gift. It has no cost of production.
  2. Land supply is perfectly inelastic. It has indestructible powers of the soil.
  3. Land has no alternative use except cultivation.
  4. Land is heterogeneous i.e., it differs in fertility.
  5. Land is subject to the law of diminishing returns whenever it is cultivated.
  6. Land of the last grade has no rent i.e., such a land is marginal or ‘no rent’ land.
  7. Land’s soil differences generate rent under perfect competition in the economy.
  8. Land accrues rent in the long run and rent is determined by the price of the produce.

Theory of Distribution Questions and Answers AP Inter 1st Year Economics Chapter 7

Question 12.
Briefly explain criticism of the Ricardian Theory of rent.
Answer:

  1. There is no perfect competition. In fact, perfect competition does not exist in agriculture.
  2. It assumes that land is restricted only to cultivation, but land has many other , uses.
  3. It is not always true that the best land is cultivated first.
  4. Rent also arises in the short run and in such cases price is determined by rent.
  5. The concept of no rent land is not true. Every land has some rent.
  6. Rent is not a payment solely for the use of land. In reality, rent is paid to all factors whose supply is inelastic.

Question 13.
What are the types of wages ? Explain them.
Answer:
Types of Wages :

  • Money Wages (or) Nominal Wages
  • Real Wages
  • Piece Wages
  • Time Wages

a) Money Wages : Money wages are also called nominal wages. Money wages refer to the amount of remuneration received by a labourer in terms of money for services rendered, whether physical or mental.

b) Real Wages : Real wages represent the purchasing power of money wages. They are expressed in terms of the goods and services a worker can buy with their money wages. Real wages are considered high when labourers can obtain a larger quantity of goods and services with their money income.

c) Piece Wages : Piece wages refer to payments made based on the amount of work completed by a labourer. Here, the skill and expertise of the labourers play a crucial role in determining their earnings. For example; a cobbler may be paid Rs.200 for manufacturing a pair of shoes or a painter may be paid Rs. 100 for painting one square meter of a wall.

d) Time Wages Time wages refer to payments made based on the duration of time worked, irrespective of the worker’s contribution to production. Wages may be paid daily, weekly, monthly, or yearly. For example, the basic salary of a bank employee is Rs. 50,000 per month.

Very Short Answer Questions

Question 1.
Contract rent.
Answer:
Generally, rent means the reward/price paid to the factor of production land. But contract rent means a periodical payment by the tenant/ user to the owners of durable goods for the use of durable commodities as per agreement or contract.
E.g: Monthly rent of a house, Hourly/ rent of a cycle, etc.

Question 2.
Economic rent.
Answer:
Rent is the price or reward paid to the factor of production, land, for its services in the production of goods and services. Economic rent is the reward paid to land, in terms of money.
It is of two types.

  1. Classical economic rent, introduced by Prof. David Ricardo,
  2. Modern economic/rent, like Scarcity rent, Quasi – rent, etc.

Question 3.
Scarcity rent.
Answer:
The concept of scarcity rent was introduced by Prof. Marshall. The supply of land is fixed or perfectly inelastic. In other words, there is scarcity of land with an increase in demand for land, the price of land increases/rises. The additional price or the rise in the price of land due to such scarcity of land is known as scarcity rent.

Question 4.
Quasi rent.
Answer:
The concept Quasi – rent was introduced by Prof. Marshall. In the short run, the supply of man – made appliances like ships, trucks, etc. is fixed or inelastic. In the short run, when the demand for them increases, they get additional income or a surplus. Such additional income derived from machines and other man-made appliances of production in the short run is called Quasi – rent. Quasi – rent appears/ exists only in the short run but disappears in the long run.

Question 5.
Transfer earnings.
Answer:
The term transfer – earnings refers to the excess or surplus amount which a factor of production.
E.g, a worker earns in the present use/employment over what he / it could earn in the. next best use.

Question 6.
Real wages.
Answer:
Real wage refers to the amount / quantity of goods that can be purchased with the money wage at any particular time. It is the money wage expressed in terms of purchasing power or general price level. It mainly depends upon the general price level. There is an inverse relationship between price level and real wage.

Question 7.
Loanable funds.
Answer:
The Loanable Funds are central to understanding how interest rates are set and how savings are channeled into productive investment in the economy. These are the money available in an economy for lending and borrowing, coming from sources like household savings, business profits, government surpluses and foreign investments.

Question 8.
Innovations.
Answer:
Innovation is central to business success, scientific progress and societal advancement. It enables organisations to stay competitive, adapt to change, and solve complex problems. Profits arise from the difference between price and production cost due to innovations. Entrepreneurs disrupt this equilibrium by introducing innovations, such as

  1. new goods,
  2. new methods of production,
  3. new markets,
  4. new sources of raw materials,
  5. industry organisation.

As a result of these innovations, the cost of production remains below and selling price, and thus profit arises.

Question 9.
Net interest.
Answer:
Interest is the price paid for the use of capital. Net interest is the reward paid for the use of capital alone. The interest paid on government bonds and government loans is called net interest.

It is the gross interest minus the total of payment for inconvenience, reward for management and insurance against risk.

Net Interest = Gross interest – (Insurance against risk + Compensation for inconvenience + Reward for management)

Question 10.
Net profit.
Answer:
Generally, profit means the reward or price paid to the factor or production entrepreneur “for his entrepreneurial abilities /functions.

Net profit is the reward earned by entrepreneur exclusively or purely for their entrepreneurial functions/ skills/abilities.

Question 11.
Piece wages.
Answer:
The wages paid according to (basing on) the work done by the worker are known as piece wages. This type of wages are paid when it is possible to measure the work done by the workers. When wages are paid according to piece rate system, efficient workers can earn more income /wages.
E.g.: If the piece rate for each unit produced is Rs. 10 each and if a worker produces 40 units in a day, the total piece wage earned by that worker is Rs. 400.

Theory of Distribution Questions and Answers AP Inter 1st Year Economics Chapter 7

Question 12.
Time wages.
Answer:
The wage paid according to the period of time is called time wage. Time wages are paid either on daily, weekly, monthly, or yearly basis. Such wages are paid, when it is not possible to measure the output of the workers. Time wages will be uniform irrespective of the efficiency of the workers.

One Word Answer Questions

Answer the following questions in ONE WORD.

Question 1.
Who said that rent is the difference between superior land and interior land?
Answer:
David Ricardo

Question 2.
Which theory of wages is formed as the Iron Law of wages?
Answer:
Subsistence Theory of rent

Question 3.
How does the interest rate react to the fall in bond prices?
Answer:
Increase or rise

Question 4.
Which term is substituted for abstinence by Marshall in the Nashau Senior abstinence theory of interest?
Answer:
Waiting

Question 5.
Who classified risks as foreseen insurable, and unforeseen, non-insurable risks?
Answer:
Prof. Knight

Fill in the blanks

Question 1.
The Law of ______________ is the base for Marginal Productivity Theory operating under perfect competition.
Answer:
Diminishing Marginal Returns

Question 2.
According to Mrs. Joan Robinson, rent is the surplus earned by a factor over the above its ______________
Answer:
Transfer earnings

Question 3.
According to Keynes the ______________ is determined by the interaction of a perfectly inelastic money supply curve and a downward-sloping liquidity preference curve.
Answer:
Interest Rate

Question 4.
According to Walker, a worker is a ______________ claimant.
Answer:
Residual

Theory of Distribution Questions and Answers AP Inter 1st Year Economics Chapter 7

Question 5.
According to Schumpeter, net profit is the reward paid for an entrepreneur’s ______________ skills.
Answer:
Innovation

Multiple Choice Questions

Question 1.
According to the modern theory of rent, rent accrue to :
1) Land only
2) Capital only
3) Any factor of production
4) Labour only
Answer:
3) Any factor of production

Question 2.
If the marginal revenue product is greater than the factor cost, the firm should hire.
1) Fewer factors
2) More factors
3) The same factors
4) All of the above
Answer:
2) More factors

Question 3.
The return to a man-made appliance due to a fixed supply in the short period is called :
1) Quasi rent
2) Contract rent
3) Economic rent
4) Scarcity rent
Answer:
1) Quasi rent

Question 4.
Find the incorrect match :
1) Dynamic Theory of profit – J.B. Clark
2) Risk Theory of profit – Prof. Hawley
3) Modern Theory of Wages – Prof. Knight
4) Wages Fund Theory – J.S. Mill
Answer:
3) Modern Theory of Wages – Prof. Knight

Question 5.
Which of the following is not a determinant of the supply of loanable funds?
1) Savings
2) Investment
3) Bank Credit
4) Dishoarding
Answer:
2) Investment

Market Structure Questions and Answers AP Inter 1st Year Economics Chapter 6

Regular practice with AP Inter 1st Year Economics Study Material Chapter 6 Market Structure Questions and Answers helps students stay prepared for examinations.

AP Inter 1st Year Economics 6th Lesson Market Structure Questions and Answers

Essay Questions

Write an essay on the following questions.

Question 1.
Describe the classification of the markets.
Answer:
The term market, generally refers to a place, where buyers and sellers meet and where; exchange or buying and selling of goods take place.

According to Benham, market can be defined as “Any area over which buyers and sellers are in such arrangement (close touch) with each other directly or through dealers, so that the price obtainable in one part of the market affect the price paid in other parts’’.

Classification of markets:

1. Basing on Competition :

a) Perfect markets : Perfect markets are those markets where there are conditions of perfect competition, like large number of buyers and sellers, homogeneous good, uniform or single price, etc.

b) Imperfect markets : Imperfect markets are those markets where there are conditions of imperfect competition, like single / two / few sellers, differentiated products, different prices, etc.

2. Basing on Area :

a) Local market: A market with few sellers and few buyers covering a limited geographical area with limited demand and limited supply is called local market. Eg : Village market for perishable goods like milk, vegetables, etc.

b) National market : A market with sellers and buyers spread/located throughout the country and with demand and supply spread throughout the country is known as national market. Eg: Market for durable goods like sugar, wheat, cotton, etc.

c) International market : A market with demand and supply spread throughout the world and purchases and sales taking place with global buyers and global sellers, at international level is known as international market or global market.

3. Basing on Time :

a) Very short period market: It is a market relating to very short period time (less than 1 day) in which supply is absolutely fixed or constant. In this market, demand plays, all or very important role in the fixation of price in the market.

b) Short period market: It is a market relating to short period (covering a time period of more than 1 day, but up to 1 year) of time. In this market, supply can be changed partially by making changes in variable inputs. In this market, in the fixation of price demand plays greater role than supply.

c) Long period market: It is a market covering / relating to a long period of time (covering a time period of more than 1 year) in which supply can be fully adjusted by making changes both in fixed inputs and variable inputs. In this market, in the fixation of price, supply plays more important role than demand.

Question 2.
Explain the market equilibrium with the help of a diagram.
Answer:
Equilibrium is a state of rest, in which there is no tendency to change. It does not mean that there is no activity or movement, but the forces are in balance. Market equilibrium can therefore be defined as a state in which neither the sellers have a tendency to increase or decrease supply nor the buyers have a tendency to increase or decrease demand. In other words, market supply equals market demand.

The market supply refers to how much of the commodity, firms would wish to supply at different prices, and the market demand refers to how much of the commodity, the consumers would be willing to purchase at different prices.

The price at which market demand is equal to the market supply is called ‘equilibrium price’ (also called as market clearing price) and quantity bought and sold at this price is called ‘equilibrium quantity’.

The following table and diagram helps to understand the market equilibrium.

Table : Demand and Supply Schedule
Price (Rs.)Quantity Demanded (kgs)Quantity Supplied (kgs)
10500100
20400200
30300300
40200400
50100500

From table, we can understand that the market attains equilibrium at Rs.30 because at this price, market demand is equal to the market supply. Hence, the price, Rs. 30 in the table is called ‘equilibrium price’ (or) ‘market clearing price’. The quantity of 300 kgs at equilibrium price is called equilibrium quantity. If the price above the equilibrium price, there will be an ‘excess supply’, and if the price below the equilibrium price, there will be an ‘excess demand’. This can be shown in the figure. Such imbalance is called disequilibrium.

Equilibrium, Excess Demand and Excess Supply:

Market Structure Questions and Answers AP Inter 1st Year Economics Chapter 6 1

Figure illustrates equilibrium for a perfectly competitive market with a fixed number of firms.

Equilibrium occurs at the intersection of the market demand curve (DD) and market supply curve (SS). The point ‘E’ is the equilibrium point. Here, the equilibrium quantity is OQ and the equilibrium price is OP. The price greater than equilibrium price (OP), there will be an ‘excess supply’, and at a price below the equilibrium price (OP), there will be an ‘excess demand’ as shown in figure.

Question 3.
Analyse the equilibrium of a firm and industry in the long run under perfect competition.
Answer:
Equilibrium of the Industry : An industry consists of a large number of independent firms. Industry is said to be in equilibrium, if there is no tendency for new firms to enter and existing firms to exit. This situation prevails if all industries earn only normal profits. If some firms earn super normal profits, the new firms may enter. If any firms are incurring loss, some firms may choose to exit.

Market Structure Questions and Answers AP Inter 1st Year Economics Chapter 6 2

From the figure, we can see that point ‘E’ is industry demand and supply curves intersect. At this point, OP is the equilibrium price and OQ is the equilibrium quantity.

An industry is not in equilibrium, if some firms earn normal profits and other firms earn supernormal profits or losses.

Equilibrium of the Firm :
A firm is said to be in equilibrium when it maximizes its profit. The output which gives maximum profit to the firm is called equilibrium output or profit maximising output. In this state, the firm has no incentive to either increase or decrease its output.

Firms in a perfectly competitive market are price-takers and industry is a price maker. This is because, there are a large number of firms in the market producing identical (homogeneous) products. No single firm is able to influence the price determined by the industry. So that, firms have to accept the price determined through the interaction of total demand and total supply of the commodity which they produce. In other words, it is the market demand and market supply that determine the price. This is the equilibrium price. All firms accept this price and determine the quantity of their product. Firms do not determine the price.

Equilibrium conditions of a firm :

  1. Marginal Cost is equal to Marginal Revenue (MC = MR).
  2. Marginal Cost (MC) curve should cuts Marginal Revenue (MR) curve from the below. That means, MC curve has a positive slope.

Market Structure Questions and Answers AP Inter 1st Year Economics Chapter 6 3

From the figure, the market price OP is fixed through the interaction of total demand and total supply of the industry. Firms have to accept this price as given and as such they are price-takers rather than price-makers. AR and MR are equal. AR = MR curve is the Demand Curve (AR) which is parallel to horizontal axis.

In the adjacent figure, firm attained the state of equilibrium at point ‘R’, where the MC curve is cutting the MR curve from below and where MC = MR.

MC = MR at point T also, where the MC curve cuts MR curve from above. If the firm stops output at this point, it will be losing opportunity to maximize its profits because MR > MC beyond T (OQ1 output).

Question 4.
Compare and contrast the different Market Structures under Imperfect Competition.
Answer:

FeaturesMonopolyMonopolistic CompetitionOligopolyDuopoly
Number of firms.Single sellerMany buyers and sellersFew dominant sellersTwo dominent sellers.
Product differentiationNo close substitutesSlight differentiationMany other homogeneous (or) differential productsCan be homogeneous or differentiated.
Price controlComplete, with prices set well above marginal cost.Limited ability to set prices due to substituted produces.Significant, often through collusion or strategic interdependence.High, with firms often mirroring each other’s pricing strategies.
Barriers to entryInsurmountableLow, allowing new firms to enter easily.High due to economies of scale.Extremely high as incumbents dominate the market.
ExamplesUtility companies (Water, electricity) patented pharmaceuticalsRestaurants, clothing brands, coffee shops.Airline industry, tele-communications, automotive manufacturers.Boeing and Airbus in commercial Aircraft.
Economic impactAllocative inefficiency, as output is lower and prices higher than socially optimal.Firms operate with excess capacity in the long run leading to higher prices than perfect competition but lower than monopolies.Prices are higher than in monopolistic competition, with profits sustained through cartel like behaviour.–

Question 5.
Write the features of Perfect Competition.
Answer:
Features of Perfect Competition : A market is said to be operate under perfect competition, when it has the following characteristic features:

  1. Large number of buyers and sellers : There must be a large number of buyers and sellers, so that any seller, or any buyer will not be able to influence the market price. The price of the product is determined by the collective forces of market demand and market supply.
  2. Homogeneous products : In perfect competition, the product of each firm produces a homogeneous product meaning, all products are identical in size, shape, quantity, quality and packaging. As a result, a single price prevails in the industry.
  3. Free entry or exit of firms : In this market, any firm can enter or exit the industry at will. This helps new firms to enter business when conditions are favourable. As long as a firm earns supernormal or normal profits, it stays in competition. But, when a firm incur losses, it would leave the market.
  4. Perfect mobility of factors of production : In this market, factors of production are free to move from one firm to another firm as per their desire. This is also useful for free entry and exit of firms. Factors of production (land, labour, capital) are free to move to the production activities where they get higher incomes.
  5. Absence of transport costs : Transport costs do not effect the prices of the commodities. Due to this, the price of the commodity will be the same throughout the market.
  6. Perfect market knowledge : It is assumed that both buyers and sellers have perfect knowledge of market conditions. Every buyer and seller knows the price of the product. In the absence of perfect knowledge, it is possible that some buyers may buy the commodity at higher prices when the same product is available at lower price.
  7. Profit maximisation : The primary goal of every firm is to maximise profits.
  8. No regulation by government: Government does not interfere in the market through price regulation, subsidies, or other means that could distort competition between firms.

Question 6.
Write about the concepts of Normal Profit and Super Normal Profit.
Answer:
Concepts of Normal Profit and Super Normal Profit : If the average revenue and average cost of the firm are equal, it earns normal profits. If average revenue is more than average cost, the firm earns supernormal or abnormal profits. If the average cost is more than average revenue, the firm incurs losses. This is shown in below diagrams.

Short run equilibrium – Super normal profits, normal profits and losses: Inperfect competition, even though all firms are following uniform price fixed by the industry, some firms enjoy with the supernormal profits, some firms may earn just normal profits and some other may incur losses. This is mainly due to differences in the firm’s cost conditions. This is explained with the help of the following figures.

1. Firm earning Super Normal Profits (AR > AC): A firm Y may earn supernormal profits or normal profits or incur losses in the short run. This is shown in figures.

Market Structure Questions and Answers AP Inter 1st Year Economics Chapter 6 4

The figure depicts, the firm is in equilibrium at point ‘E’ where marginal revenue is equal to marginal cost (MC = MR). OQ is the equilibrium output for the firm. At this level of output, the average revenue (or) price per unit is EQ and average total cost is BQ. The firm’s profit per unit is EB (AR – ATC). Total profit is ABEP. (EB × OQ; OQ = AB). Applying the principle, Total Profit = TR -TC, we find totalprofit as the difference between OPEQ and OABQ which is equal to ABEP. It represents supernormal or abnormal profits.

2. Firm earning Normal Profits (AR = AC): The figure, shows that the firm attained equilibrium at point ‘E’, where it’s MR = MC. The equilibrium output is OQ. At this level of output, price or AR covers full cost (ATC). Since AR = ATC (or) OP = EQ, the firm is just earning normal profits. Applying TR – TC, we find that TR – TC = zero (or) there is zero economic profit (or) no profit and no loss.

Market Structure Questions and Answers AP Inter 1st Year Economics Chapter 6 5

3. Firm incurring Losses (AR < AC): In the short run, some perfectly competitive firms may incur losses even at equilibrium state (MC=MR). But the firm try to minimise the losses so as to stay on the business. For all prices above the minimum point on the AVC curve, the firm will stay open and will produce the level of output at which MR = MC. When the firm is able to meet its variable cost and a part of fixed cost, it will try to continue production in the short run.

Market Structure Questions and Answers AP Inter 1st Year Economics Chapter 6 6

In the figure, point ‘E’ is the equilibrium point. At this point, the firm’s average total cost (ATC) curve lies above the firm’s average revenue (AR) curve and incurring a loss per unit worth of BE. Because, at this point, AR = EQ and ATC = BQ.

Market Structure Questions and Answers AP Inter 1st Year Economics Chapter 6

Question 7.
Explain price determination under perfect competition in long run.
Answer:
Equilibrium of a Competitive Firm : All perfectly competitive firms are in equilibrium in the long run when they have adjusted their plant so as to produce at the minimum point of their long run ATC curve, which is tangent to the demand curve defined by the market price.

Market Structure Questions and Answers AP Inter 1st Year Economics Chapter 6 7

In the long run, all firms will be earning just normal profits, which are included in the ATC. If they are making supernormal profits in the short run, new firms will enter the industry. This will lead to an increase in supply and a fall in price (a downward shift in the individual demand curves) and an upward shift of the cost curves due to an increase in the prices of factors as the industry expands. New firms enter until all firms earn only normal profits. These changes will continue until the ATC is tangent to the demand curve (AR curve) at its minimum point. If the firms make losses in the short run, they will leave the industry in the long run. This will decrease supply and raise the price and costs may fall as the industry contracts. Exit of firms continue till all firms losses disappear and even firm get only normal profits.

The condition for long run equilibrium of the firm is that the marginal cost should be equal to the price and the long run average cost i.e.,

LMC = LAC = P.

The firm adjusts its plant size so as to produce that level of output at which the LAC is at its minimum position. At equilibrium, the short-run marginal cost is equal to the long run marginal cost and the short run average cost is equal to the long run average cost. Thus, in the long run we have,

SMC = LMC = SAC – LAC = P = MR

Short Answer Questions

Write the answers briefly for the following questions.

Question 1.
Discuss the features of perfect competition with reference to price determination.
Answer:
Perfect competition is a theoretical market structure characterized by specific features that collectively ensure prices are determined solely by supply and demand.

Reference to Price Determination :

Equilibrium Price : The intersection of the market demand and supply curves determines the equilibrium price. At this price, the quantity demanded equals the quantity supplied, eliminations shortages or surpluses,

  1. Demand Curve : Slopes downward, reflecting higher quantity demanded at lower prices.
  2. Supply curve : Slopes upward, indicating higher quantity supplied at higher prices.

Role of Firms as Price Takers: Individual firms adjust output to the equilibrium price but can’t set prices. For example, a wheat farmer must sell at the market price: changing more would drive buyers to competitors.

Long-run Adjustments :

  • Supernormal Profits : Attract new firms, increasing supply and lowering prices until profits normalize.
  • Losses : Cause firms to exit, reducing supply and raising prices until losses are eliminated.

In the long run, price equal to MC and ATC, ensuring efficient production.

Question 2.
Compare Perfect Competition and Monopoly.
Answer:

Perfect CompetitionMonopoly
1. Large number of sellers.1. Single seller exists in the market.
2. Free entry and free exit of firms.2. Restrictions on the entry of new firms.
3. Homogeneous product.3. No close substitutes to the product.
4. Difference between industry and firm.4. Both industry and firm are the same.
5. Industry is a price maker and firms are price takers.5. Monopolist is a price maker.
6. Uniform price prevails for the same good.6. Price distrimination is possible.
7. Price, AR and MR are the same and the curve is parallel to the OX-axis.7. AR and MR curves are different and slope downwards from left to right.

Question 3.
Explain the concepts of Price Floor and Price Ceiling.
Answer:
Price Floor:
When the government imposes lower limit on the price that may be charged for a particular good or service, it is called a ‘price floor’. The most well-known examples of the imposition of price floors are agricultural price support programmes and the minimum wage legislation. Through agricultural price support programmes, the government imposes a lower limit on the purchase price for some agricultural goods. The price floor is normally set above the market-determined price for these goods.

Market Structure Questions and Answers AP Inter 1st Year Economics Chapter 6 8

Price Ceiling:
When the government imposes an upper limit on the price of a good or service, it is called a ‘price ceiling’. A price ceiling is generally imposed on ‘essential items’ like wheat, rice, kerosene, and sugar. Price ceiling is fixed below the market-determined price if it is high. Since low income sections of the population will not be able to afford these goods at the market price.

Market Structure Questions and Answers AP Inter 1st Year Economics Chapter 6 9

Question 4.
What are the feature of Monopoly ? Explain the price determination under monopoly.
Answer:
Monopoly Features :

  1. A single firm produces the good in the market.
  2. No close substitutes for this good.
  3. Strong barriers exist for the entry of new firms into market, which means that there is no competition.
  4. Both industry and firm are one and the same.
  5. Monopolist determines the price (Price maker).
  6. The degree of Monopoly power depends on the price elasticity of demand, it is relatively high.
  7. Producer controls either the price of the good or the supply of the good. But he cannot control both simultaneously.
  8. The demand curve of a monopoly firm slopes downward from left to right, because the demand is relatively inelastic. This is because, there are no close substitutes.
  9. The monopolist practices price discrimination by charging different prices from different buyers to increase profits.
    This practice depends on the differences in elasticity of demand.

Price Determination : Fig. shows the equilibrium of a monopoly firm. AR and MR are downward sloping curves. The firm reaches its equilibrium when MC = MR. ‘E’ is the equilibrium point. OP is the equilibrium price, and OQ is the equilibrium output.

Market Structure Questions and Answers AP Inter 1st Year Economics Chapter 6 10

In the short-run a monopoly firm may earn supernormal profits or losses. But it earns only super normal profits in the long-run.

Question 5.
Define Monopolistic competition and write its features.
Answer:
In real world we rarely find perfect competition and monopoly. In the majority of cases, there is neither a single individual who controls the total supply, nor many sellers so that their individual shares are negligible in relation to the total supply of the market. Thus, the real situation is one of imperfect competition, where there is neither perfect competition nor absolute monopoly. This market situation is known as ‘Monopolistic Competition.
Eg.: Smart phones, soft drinks etc.

Prof. E. H. Chamberlin and Mrs. Joan Robinson pioneered this market analysis in economics. According to Chamberlin, the important characteristics of monopolistic competition are as follows:

Features:

  1. Large number of buyers and sellers.
  2. Product differentiation (Heterogeneous product).
  3. Freedom of entry and exit of firms.
  4. Competitive advertising (or) selling costs.
  5. Downward sloping and more elastic demand curve due to availability of close substitutes.
  6. Non-price competition.
  7. Normal profits in the long-run and finds the excess capacity.
  8. Relatively low degree of monopoly power.
    This market is discussed in detail in higher classes.

Question 6.
Write the features of Oligopoly.
Answer:
Features :

  1. Very few sellers of the product.
  2. Interdependence of firms in decision making.
  3. Presence of monopoly power.
  4. Existence of price rigidity.
  5. Excessive expenditure on advertisement.
  6. Indeterminate demand curve due to high degree of interdependence among firms.
  7. Group behaviour.

Market Structure Questions and Answers AP Inter 1st Year Economics Chapter 6

Question 7.
Define the term Duopoly and write its features.
Answer:
Duopoly is a special form of oligopoly, where only two sellers produce the goods. It is also caracals a limited form of oligopoly. The goods produced by the producers may be homogenous or differentiated. As there are only two producers, both are aware that the decisions of one will affect the other. Rivalry and collusion of the producers are both possible in this market situation.

Features:

  1. Only two firms (sellers) of the product.
  2. Strategic interdependence.
  3. High level of market concentration.

Very Short Answer Questions

Question 1.
Normal Profits.
Answer:
If the average revenue and average cost of the firm are equal, it means normal profit. It is considered part of businesses total costs and is essential for long term sustainability, especially in perfectly competitive markets when, in the long run, firms tend to make only normal profit.

Question 2.
Equilibrium conditions of a firm under perfect competition.
Answer:

i) Condition Equilibrium RuleShort Run MC = MR = PLong Run MC = MR = P = (Min ATC)
ii) Profit Level zero, or negationCan be positive,Zero (normal profit)
iii) Entry / ExitNot possibleFree entry and exit.

These conditions ensure that under perfect competition, each firm produces at the most efficient scale and has no incentive change its output or leave / enter the market.

Question 3.
Discriminating monopoly.
Answer:
A discriminating monopoly is a type of monopoly where a single firm dominates the market and changes different prices for the same product or service to different consumers or market segments, not based on cost differences but on consumers, willingness on ability to pay. This practice is also known as price discrimination. The main purpose of discriminating monopoly is to increase profits by extracting more consumer surplus.

Question 4.
Selling costs.
Answer:
Selling costs mean the costs incurred by business firms towards attracting customers and for the sale of the goods.
Eg : Advertising and publicity costs, free sampling, etc. Selling costs are very important in monopolistic competition and in oligopoly where there is severe or intense competition among the firms.

Question 5.
Duopoly.
Answer:
A market where there are two sellers or firms is known as duopoly. As there are only two firms in the market, each firm or seller will have comparatively large share in the market. In duopoly, there is close interdependence between firms and a lot of uncertainty in the behaviour of sellers.

Question 6.
Oligopoly.
Answer:
A market where there are few sellers (3 or 4 firms or sellers) is known as oligopoly. Such firms may produce either homogeneous good or differentiated product. There is severe competition and close interdependence among the firms in the market. There is a lot of uncertainty among the firms in the market.

Question 7.
Break even point.
Answer:
BEP is the level at which a businesse’s total revenue exactly equals its total costs (both fixed and variable), resulting in neither profit nor loss. At this point, a company has covered all its expenses, and any sales beyond this point generate profit. The BEP is where business covers all costs with zero profit or loss and is of a fundamental measure for business management.

Question 8.
Shut down point.
Answer:
In short-run, the firm continues to produce as long as the price (AR) remains greater than or equal to the minimum of AVC (AR > AVC). When the firm’s Average Revenue (AR) is less than Average Cost (AC) and equal to Average Variable Cost, it is continues to operate with losses. This situation is known as the shut down point, (AR = AVC).

Question 9.
Price ceiling.
Answer:
When a government imposes an upper limit on the price of a good or service it is called a price ceiling. It is generally imposed on essential items like wheat, rice, kerosene, and sugar. It is fixed below the market-determined price if it is high. Low income people will not be able to afford these goods at the market price.

Market Structure Questions and Answers AP Inter 1st Year Economics Chapter 6

Question 10.
Price floor.
Answer:
When the government imposes lower limit on the price that may be changed for a particular good or service it is called a price floor. The most well known examples of the imposition of price floors are agricultural price support programmes and the minimum wage legislation.

One Word Answer Questions

Answer the following questions in ONE WORD.

Question 1.
The Average Revenue (AR) curve is also known as :
Answer:
Demand Curve

Question 2.
The firm’s demand curve in perfect competition is :
Answer:
Parallel to X axis (Horizontal)

Question 3.
Imposing upper limit on the price of good or service by the government is called:
Answer:
Price ceiling

Question 4.
When there is decrease in demand with unchanged supply of a good then equilibrium price?
Answer:
Decrease

Question 5.
In the long run, the industry is in equilibrium when all the firms in a perfectly competitive market earn :
Answer:
Normal Profits

Fill in the blanks

Question 1.
When average revenue is equals to Rs.20/- and average cost is equals to Rs. 15/- then the firm makes ___________ profits.
Answer:
Super normal

Question 2.
No close substitutes is a feature of a ___________ market.
Answer:
monopoly

Question 3.
P = AR = MR is a feature of a ___________ market structure.
Answer:
Perfect competition

Question 4.
‘Indeterminate demand curve’ is a feature of a ___________ market.
Answer:
Oligopoly

Market Structure Questions and Answers AP Inter 1st Year Economics Chapter 6

Question 5.
A point on supply curve at which firm earns only normal profit is called the ___________ point.
Answer:
Break even

Multiple Choice Questions

Question 1.
The price at where market demand is equal to market supply is known as :
1) Short run Price
2) Long run Price
3) Normal Price
4) Equilibrium Price
Answer:
4) Equilibrium Price

Question 2.
As shut-down point :
1) AR = AC
2) AR > A VC
3) AR < AVC
4) AR = AVC
Answer:
4) AR = AVC

Question 3.
Which of the following is not a feature of Monopoly?
1) One buyer and one seller
2) No close substitutes
3) One seller and many buyers
4) Full control over price by the seller
Answer:
1) One buyer and one seller

Question 4.
The condition of equilibrium of a firm in perfect competition is:
1) Average Revenue = Average Cost
2) Marginal Revenue > Marginal Cost
3) Average Revenue – Average Variable Cost
4) Marginal Revenue = Marginal Cost
Answer:
4) Marginal Revenue = Marginal Cost

Question 5.
Break-Even Point is a situation, where firm is in:
1) Profit
2) Loss
3) No profit and no loss
4) Can’t say anything
Answer:
2) Loss

Cost and Revenue Analysis Questions and Answers AP Inter 1st Year Economics Chapter 5

Regular practice with AP Inter 1st Year Economics Study Material Chapter 5 Cost and Revenue Analysis Questions and Answers helps students stay prepared for examinations.

AP Inter 1st Year Economics 5th Lesson Cost and Revenue Analysis Questions and Answers

Essay Questions

Write an essay on the following questions.

Question 1.
Explain the different short-run cost structure of a firm.
Answer:
In the short run, a firm’s cost structure can be broken down into several key components. It is important to understand these different types of costs of analyze a firms profitability and decision-making. Here are the main short-run cost concepts.

1. Fixed Cost (FC):
These are costs that do not change with the level of output in the short run. They remain constant regardless of whether the firm produces a lot, a little, or even nothing at all. These are associated with the firm’s fixed factors of production, such as plant and equipment and contractual obligations.
Eg: Rent for building and land, salaries of permanent staff.

2. Variable Costs (VC) :
These are costs that change directly with the level of output. As the firm produces more, its variable costs increase, as it produces less they decrease. If the firm produces nothing, its variable costs are zero.
Eg: i) Cost of raw-materials.
ii) Wages of temporary (or) hourly workers.

3. Total Costs (TC):
This is the sum of all costs incurred by a firm in producing a certain level of output. It is the combination of total fixed costs and total variable costs.
TC = TFC + TVC
Since fixed costs remain constant in the short run, changes in total cost are solely driven by changes in variable costs as output levels fluctuate.

4. Average Fixed Costs (AFC) :
This is the fixed cost per unit of output. It is calculated by dividing total fixed cost by the quantity of output (Q).

The formula for Average Fixed Cost = AFC = \(\frac{FC}{Q}\). AFC decreases as output increases because the constant total fixed cost is spread over a larger number of units. This results in a downward sloping AFC curve.

5. Average Variable Cost (AVC) :
This is the variable cost per unit of output. It is calculated by dividing total variable cost by the quantity of output (Q).
The formula for Average Variable Cost = AVC = \(\frac{VC}{Q}\).

The AVC curve is typically U shaped. Intially, as output increases, AVC may fall due to increasing efficiency. However beyond a certain point, as variable factors become less productive (due to the law of diminishing returns) AVC starts to rise.

6. Average Total Cost or Average Cost (ATC or AC) :
This is the total cost per unit of output. It can be calculated in two ways:

  • Dividing Total Cost by the quantity of output, ATC = \(\frac{TC}{Q}\).
  • Adding Average Fixed Cost and Average Variable Cost.
    ATC = AFC + AVC

The ATC curve is also typically U-shaped. It reflects the combined influence of the falling AFC and the U-shaped AVC. ATC falls initially as AFC decreases rapidly, but eventually rises as the increase in AVC outweighs the decrease in AFC. The minimum point of the ATC curve represents the most efficient level of production in the short run.

7. Marginal Cost (MC) :
It is the additional cost incurred by producing one more unit of output. It measures the change in total cost resulting from a one-unit change in quantity. The formula for MC = \(\frac{\Delta \mathrm{TC}}{\Delta \mathrm{Q}}\).

Since fixed costs do not change with output, marginal cost is also equal to the change in total variable cost resulting from a one unit change in quantity.

MC = \(\frac{\Delta \mathrm{VC}}{\Delta \mathrm{Q}}\)

The MC curve is also typically U-shaped. It initially falls due to increasing marginal returns but eventually rises due to diminishing marginal returns. TheMC curve insects both the AVC and ATC curves at their minimum points.

Question 2.
Compare the relationship between AR and MR under perfect competition and imperfect competition.
Answer:
In Economic returns, the relationship between AR and MR varies significantly depending on the market structure specifically between perfect competition and imperfect competition.

Perfect Competition : In a perfectly competitive market, firms are price takers, meaning they have no control over the market price. The market price is determined by the interaction of supply and demand. Under these conditions ;

AR : The AR is equal to market price. This is because each unit sold fetches the same price, and thus, the total revenue divided by the number of units sold is the market price.

MR : The marginal revenue is also equal to the market price. This is because selling an additional unit does not affect the price, and the revenue from the additional unit is the same as the market price.
So, AR = MR = Price

Table : Revenue under Perfect Competition (in Rs.)
OutputPriceTotal RevenueAverage RevenueMarginal Revenue
110101010
210201010
310301010
410401010
510501010
610601010

Cost and Revenue Analysis Questions and Answers AP Inter 1st Year Economics Chapter 5 1

Cost and Revenue Analysis Questions and Answers AP Inter 1st Year Economics Chapter 5 2

It is clear from the table and diagrams that the total revenue increases with an increase in quantity. When there is no change in price, average revenue remains the same. Marginal revenue is equal to the average revenue is fig. TR curve slopes upwards with a constant slope. Since, AR = MR it is the same curve which are horizontal and parallel to OX-axis. The AR curve is called Demand Curve.

Imperfect Competition : In Imperfect competition, which includes monopolistic competition and oligopoly, firms have some degree of market power and can influence the price of their products. This leads to a different relationship between AR and MR.

AR : The AR is the price at which the firm sells its products. However, to sell more units, the firm must lower its price, which affects the AR.

MR : The MR is less than the AR. This is because to sell an additional unit, the firm must lower the price on all units sold, not just the additional unit. Therefore, the revenue from the additional unit is less than the price of that unit.

MR < AR

Table (in Rs.)
OutputPriceTotal RevenueAverage RevenueMarginal Revenue
110101010
291898
382486
472874
563062
653050
74284– 2
83244– 4

Cost and Revenue Analysis Questions and Answers AP Inter 1st Year Economics Chapter 5 3

The table and diagrams (figures) reveals that as price falls, sales may improve and total revenue also increases gradually. Hence, the TR curve initially increases, reaches its maximum at a certain level of output and then falls after reaching its maximum. So that the shape of TR curve takes an “inverted U” shape. On the other hand, as the price falls, average revenue and marginal revenue decrease. Hence, the AR and MR curves slope, downwards and MR curve lies below the AR curve. It is to be noted that MR can be zero or even negative, but AR cannot be zero.

Relationship between TR and MR:

  1. When TR increases MR falls.
  2. When TR reaches its maximum (or) remains constant, MR becomes zero.
    (The slope of TR = 0).
  3. When TR decreases, MR becomes negative.

Question 3.
Discuss the Long-run Cost Curves with a suitable diagram.
Answer:
Shape of Long run Cost Curves :

Let us check how the LRMC curve looks like. For the first unit of output, both LRMC and LRAC are the same. Then, as output increases, LRAC initially falls, and then, after a certain point, it rises. As long as average cost is falling, marginal cost must be less than the average cost. When the average cost is rising, marginal cost must be greater than the average cost. LRMC curve is a ‘U’-shaped curve. It cuts the LRAC curve from below at the minimum point of the LRAC. This is shown in Fig. (a)

Long-run average cost curve:

The long run average cost curve (LAC) is a smooth curve enveloping all short-run average cost curves (SACs). The LAC is drawn as tangent to each of the SACSs. The long run average cost curve (LAC) is called ‘planning curve’, ‘boat shaped curve’ and ‘envelope curve’. Whereas, the short- run average cost curves (SACs) are called ‘plant curves’.

When LAC is declining, it is tangent to the falling portions of SACs and when LAC is rising, it is tangent to the rising portions of SACs. Hence, the LAC is a “U” shaped curve. The behaviour of LAC depends upon the “Law of returns to scale” (fig.(b)).

Cost and Revenue Analysis Questions and Answers AP Inter 1st Year Economics Chapter 5 4

Cost and Revenue Analysis Questions and Answers AP Inter 1st Year Economics Chapter 5 5

Cost and Revenue Analysis Questions and Answers AP Inter 1st Year Economics Chapter 5

Question 4.
Discuss the short-run Cost Curves with a suitable diagram.
Answer:
Short-run Total Costs – Graph :
These are, total fixed cost (TFC), total variable cost (TVC) and total cost (TC) curves for a firm. Total cost is the vertical sum of total fixed cost and total variable cost.

Cost and Revenue Analysis Questions and Answers AP Inter 1st Year Economics Chapter 5 6

In the figure, output is measured on OX – axis and costs on OY-axis. Since total fixed cost remains constant at all levels of output in the short-run, TFC curve is a horizontal line and parallel to the OX-axis. On the other hand, TVC curve rises along with the level of output. It starts from origin and slopes upwards to the right. The sum of TC curve and TVC curve is rise with the level of output and slopes upwards to the right. TC and TVC curves are parallel to each other as the difference is the same (TFC).

Short run Average Costs :

Cost and Revenue Analysis Questions and Answers AP Inter 1st Year Economics Chapter 5 7

Fig. shows the average and marginal cost curves. It may be observed that AFC falls from downwards left to right continuously. The fall is steep in the beginning but flatter later. The AFC curve is convex to origin. This curve is a rectangular hyperbola. It is because at any point on the curve multiplication of the AFC by the number of output units gives fixed value.

Both ATC curve and the AVC curve fall upto a point and rise later. The curves are ‘U’-shaped cost curves. It may be observed that ATC curve is above the AVC curve and the distance between the two keeps declining. Because it represents the AFC which continuously declining, MC curve is also a U-shaped cost curve. It cuts both ATC and AVC from below at their minimum (lowest) points.

Short Answer Questions

Write the answers briefly for the following questions.

Question 1.
Briefly explain the various concepts of costs.
Answer:
The following are the various concepts of costs.

  1. Explicit Costs : These are actual monetary payments made for resources like wages, rent and materials.
    Eg: Rent for the factory building
  2. Implict Costs : Cost of using resources owned by the firm itself; without direct monetary payment.
    Eg : Owner’s time or capital.
  3. Opportunity Cost : It is the cost of next best alternative, sacrificed in order to obtain that commodity. These are also called alternative cost.
  4. Money Cost: The money outlays of a firm in the process of production of its output, in terms of money are called money costs.
    Eg. : Wages and salaries.
  5. Real Cost : It is defined as the efforts and sacrifices producer has to make for producing a desired output.
  6. Short run Costs : These refer to costs relating to the short period of time.
    Eg.: Capital equipment.
  7. Long run Costs : These relating to the long period of time. All costs are variable in the long run.

Question 2.
Explain the relationship between Average Cost and Marginal Cost with the help of diagram.
Answer:
Relationship between Average cost and Marginal Cost :
The Average Cost (AC) is the cost per unit of output and the Marginal Cost (MC) is the total cost of producing an additional unit of output.

The average and marginal cost concepts are important to a producer in determining the optimum output. Both Average Cost (AC) and Marginal Costs (MC) are “U” shaped due to the operation of “the law of variable proportions”. The minimum point of Average Cost (AC) curve is called the “Optimum point”. At optimum point, Average Cost is equal to Marginal Cost (AC = MC). The output at optimum point is called “Optimum output”, shown in the figure.

Cost and Revenue Analysis Questions and Answers AP Inter 1st Year Economics Chapter 5 8

From the graph it is clear that,

a) When AC is falling MC lies below the AC i.e., MC is less than AC (MC < AC). MC may be falling or rising in this condition.
b) When AC is minimum (constant) at point ‘E’, MC is equal to AC (MC = AC). This point called optimum point and OQ output is optimum output
c) When AC is rising beyond OQ level of output, MC is also rises and becomes greater than AC (MC > AC).

Question 3.
What is Revenue ? Explain different types of Revenues.
Answer:
Revenue : The amount of money that the producer receives in exchange for the goods (sale proceeds) is called producer’s receipts or revenue. In other words, the total sale proceeds of a firm is known as revenue. There are three types of revenue: i) Total Revenue, ii) Average Revenue, and iii) Marginal Revenue.

Total Revenue (TR) : Total amount of money or income received by the firm from the sale of a certain quantity of output is called total revenue. It is obtained by multiplying the price of a commodity by the number of units sold i.e. TR = P × Q.
P = Price of the good
Q = The quantity of the good sold.

Average Revenue (AR) : It is the revenue per unit of good sold. It is computed by dividing the total revenue by the number of units of a good sold.
AR = \(\frac{T R}{Q}\)
= \(\frac{P \times Q}{Q}\) = P
It is clear that the AR at each level of output is equal to the price per unit i.e. AR = P.

Marginal Revenue : It is the addition to the total revenue by selling one additional unit of the good i.e., the revenue which would be earned by selling an additional unit of the good.
MR = \(\frac{Change in TR}{Change in Quantity}\)
= \(\frac{\Delta \mathrm{TR}}{\Delta \mathrm{Q}}\)
MRn = TRn – TRn-1

Question 4.
Explain the Revenue Curves in imperfect competition.
Answer:
MR < AR

Table (in Rs.)
OutputPriceTotal RevenueAverage RevenueMarginal Revenue
110101010
291898
382486
472874
563062
653050
74284– 2
83244– 4

The table and diagrams (figures) reveals that as price falls, sales may improve and total revenue also increases gradually. Hence, the TR curve initially increases, reaches its maximum at a certain level of output and then falls after reaching its maximum. So that the shape of TR curve takes an ‘inverted U” shape. On the other hand, as the price falls, average revenue and marginal revenue decrease. Hence, the AR and MR curves slope downwards and MR curve lies below the AR curve. It is to be noted that MR can be zero or even negative, but AR cannot be zero.

Cost and Revenue Analysis Questions and Answers AP Inter 1st Year Economics Chapter 5 9

Relationship between TR and MR:

  1. When TR increases MR falls.
  2. When TR reaches its maximum (or) remains constant, MR becomes zero. (The slope of TR = 0).
  3. When TR decreases, MR becomes negative.

Question 5.
The following table shows the total cost schedule of a firm. Calculate the TFC, TVC, AFC and AVC schedule of the time.

QTC
010
130
245
355
470
590
6120

Answer:

QTCTFCTVCAFCAVC
0101000–
130102010.0020.00
24510355.0017.50
35510453.3015.00
47010602.5015.00
59010802.0016.00
6120101101.6518.33

Question 6.
Compute the Total Revenue, Average Revenue and Marginal Revenue schedules in the following table. Market price of each unit of the good is Rs. 10%.

Cost and Revenue Analysis Questions and Answers AP Inter 1st Year Economics Chapter 5 10

Answer:

Quantity SoldTR (P.Q)AR PriceMR = TRn – TRn-1
010 × 1 = 101010 – 0 = 10
210 × 2 = 20\(\frac{20}{2}\) = 1020 – 10 = 10
310 × 3 = 30\(\frac{30}{3}\) = 1030 – 20 = 10
410 × 4 = 40\(\frac{40}{4}\) = 1040 – 30 = 10
510 × 5 = 50\(\frac{50}{5}\) = 1050 – 40 = 10
610 × 6 = 60\(\frac{60}{6}\) = 1060 – 50 = 10

Question 7.
The following table shows the total cost schedule of a firm. What is the total fixed cost schedule of this firm? Calculate the TVC, AFC, AVC, AC and MC schedules of the firm.

QTC
010
130
245
355
470
590
6120

Answer:

QTCTFC (TC at 0)TVC (TC – TFC)AFC = TFC ÷ OutputAVC = TVC ÷ OutputAC = TC ÷ OutputMC = TCn – TC n-1
010100            ––            ––
130102010203020
2451035517.5022.515
35510453.331518.3310
47010602.501517.5015
590108021618.0020
6120101101.6718.3320.0030

Cost and Revenue Analysis Questions and Answers AP Inter 1st Year Economics Chapter 5

Question 8.
The following table gives the total cost schedule of a firm. It is also given that the average fixed cost at 4 units of output is Rs.5. Find the AVC, AFC, AC and MC schedule of the firm for the corresponding values of output.

QTC
150
265
375
495
5130
6185

Answer:

OutputTCTFCTVCSACAFCAVCSMC
150203050203030
265204532.501022.5015
3752055256.6718.3310
495207523.75518.7520
5130201102642235
61852016530.833.3327.5055

Formulas :

  1. TVC = TC – TFC
  2. SAC (AC) = TC ÷ Output.
  3. AVC = TVC ÷ Output
  4. SMC(n) (MCn) = TCn – TCn-1
  5. TFC = AFC × Unit of output = 5 × 4 = Rs.20
  6. AFC = \(\frac{TFC}{Output}\)

Very Short Answer Questions

Question 1.
Explicit Cost.
Answer:
The remuneration paid to outside factors of production is called explicit costs. They involve cash payments and are recorded in the books of accounts. Explicit costs are also called “Accounting costs”.
Eg.: Wages to the labourers, rent for the factory building, payments for raw materials, etc.
Both economists and accountants take them into account.

Question 2.
Implicit Cost.
Answer:
The cost of factors owned by the entrepreneur himself and employed in his own business is called implicit costs. These are also called as imputed costs.
Eg : Rent of own factory building, interest on own money, capital investment Economists take into account implied costs also while accountants ignore them, because no monetary transactions takes place.

Explicit Cost + Implicit cost = Total Cost

Question 3.
Opportunity Cost.
Answer:
Opportunity Cost is the cost of next best alternative, sacrificed in order to obtain that commodity.

It is a loss of income due to opportunity foregone. Opportunity cost is also called ‘alternative cost’. It arises because of scarcity and alternative uses of resources.

Question 4.
Enveloping curve.
Answer:
Long-run average cost curve:

Cost and Revenue Analysis Questions and Answers AP Inter 1st Year Economics Chapter 5 11

The long run average cost curve (LAC) is a smooth curve enveloping all short-run average cost curves (SACs). The LAC is drawn as tangent to each of the SACs. The long run average cost curve (LAC) is called ‘planning curve’, ‘boat shaped curve’ and ‘envelope curve’. Whereas, the short-run average cost curves (SACs) are called ‘plant curves’.

When LAC is declining, it is tangent to the falling portions of SACs and when LAC is rising, it is tangent to the rising portions of SACs. Hence, the LAC is a “U” shaped curve. The behaviour of LAC depends upon the “Law of returns to scale” (fig-(b))

Question 5.
Diagram showing AC and MC.
Answer:

Cost and Revenue Analysis Questions and Answers AP Inter 1st Year Economics Chapter 5 12

a) When AC is falling MC lies below the AC i.e., MC is less than AC (MC < AC). MC may be falling or rising in this condition.
b) When AC is minimum (constant) at point ‘E’, MC is equal to AC (MC = AC). This point called optimum point and OQ output is optimum output.
c) When AC is rising beyond OQ level of output, MC is also rises and becomes greater than AC (MC > AC).

Question 6.
Horizontal Revenue Curve.
Answer:
We have seen that a perfectly competitive firm’s marginal revenue curve is simply a horizontal line at the market price and that this same line is also the firm’s average revenue curve.

For the perfectly competitive firm,
MR = P = AR.

Cost and Revenue Analysis Questions and Answers AP Inter 1st Year Economics Chapter 5 13

Question 7.
Sloping AR, MR Curves Text.
Answer:
As the price falls, AR and MR decrease. Hence the AR and MR curves slope downwards and MR curve lies below the AR curve. It is to be noted that MR can be zero or even negative, but AR can not be zero.

Cost and Revenue Analysis Questions and Answers AP Inter 1st Year Economics Chapter 5 14

Question 8.
The following table shows the total revenue and total cost schedules of a competitive firm. Calculate the profit at each level output.
Answer:

Quantity soldTR (Rs.)TC (Rs.)Profit (TR – TC) Rs.
005(0 – 5) = – 5
157(5 – 7) = – 2
21010(10 – 10) = 0
31512(15 – 12) = 3
42015(20 – 15) = 5
52523(25 – 23) = 2
63033(30 – 33) = – 3
73540(35 – 40) = – 5

Question 9.
From the following details, find out the Average Variable Cost of 10 units.

Output (Units)Total Cost (in Rs.)
0100
5200
10400
15600

Answer:
AVC = \(\frac{TVC}{Q}\)
Total Cost for 0 units =100 Rs.
Total Cost for 10 units = 400 Rs.
TVC = TC – TVC = 400 – 100 = 300
AVC = \(\frac{300}{10}\) = 30
∴ The Average Variable Cost AVC for 10 units is Rs. 30 per unit.

Cost and Revenue Analysis Questions and Answers AP Inter 1st Year Economics Chapter 5

Question 10.
What is the Average total cost in producing 20 units ? If fixed cost is Rs. 1000/- and average variable cost is Rs. 2 ?
Answer:
Fixed Cost = 1,000 Rs.
AVC = Rs. 2
Quantity = 20 units
TVC = AVC × Q
= 2 × 20 = 40

TC = FC + TVC
= 1000 + 40 = 1040
∴ The Average total cost in producing 20 units is Rupees 52 per unit.

One Word Answer Questions

A) Answer the following question in ONE WORD.

Question 1.
Mr. Sreenu is working as a manager in his own factory. Which concept of cost covers the salary of Mr. Sreenu?
Answer:
Implicit cost

Question 2.
The Average Cost (AC) minus Average Fixed Cost (AFC) equals to:
Answer:
Average Variable Cost (AVC)

Question 3.
If after selling 10 units the total revenue is Rs. 10,000 and after selling 12 units the total revenue increases to Rs. 15,000- then marginal revenue is:
Answer:
Rs. 2,500

Question 4.
The Average Revenue (\(\frac{TR}{Q}\)) is always equals to:
Answer:
Price

Question 5.
The mathematical relation between cost of a product and the various determinants of cost is known as:
Answer:
Cost function

Fill in the blanks

Question 1.
The cost incurred by producing an additional unit of output is ___________.
Answer:
Marginal Cost

Question 2.
The Long-run Average Cost (LAC) curve is also called as ___________.
Answer:
Envelope curve

Question 3.
The shape of average fixed cost curve is ___________.
Answer:
Rectangular hyperbola

Question 4.
When the average cost is at its minimum, then the marginal cost is ___________.
Answer:
Equal to average cost

Cost and Revenue Analysis Questions and Answers AP Inter 1st Year Economics Chapter 5

Question 5.
When the average revenue decreases, then the marginal revenue is ___________.
Answer:
Less than average revenue

Multiple Choice Questions

Question 1.
The costs of self-owned and self-employed resources are termed as:
1) Accounting cost
2) Explicit cost
3) Money cost
4) Implicit cost
Answer:
4) Implicit cost

Question 2.
Find the total cost, when TFC = Rs. 200/- and TVC = Rs.225 :
1) Rs. 200
2) Rs.225
3) Rs.425
4) Rs.25
Answer:
3) Rs.425

Question 3.
If the total cost at 5 units of output is Rs.5007 and at 7 units, it is Rs. 7007. Find the marginal cost at 7th unit (In Rs.)?
1) 400
2) 300
3) 200
4) 100
Answer:
4) 100

Question 4.
The Total Cost (TC) at zero (0) units of output is:
1) Equal to zero
2) Equal to total fixed cost
3) Equal to total variable cost
4) Equal to marginal cost
Answer:
2) Equal to total fixed cost

Question 5.
The minimum point of the Average Cost (AC) curve is known as:
1) Equilibrium point
2) Break Even Point (BEP)
3) Point of inflexion
4) Optimum point
Answer:
4) Optimum point

Production Analysis Questions and Answers AP Inter 1st Year Economics Chapter 4

Regular practice with AP Inter 1st Year Economics Study Material Chapter 4 Production Analysis Questions and Answers helps students stay prepared for examinations.

AP Inter 1st Year Economics 4th Lesson Production Analysis Questions and Answers

Essay Questions

Write an essay on the following questions.

Question 1.
Explain the law of variable proportion with the help of a diagram.
Answer:
An important law relating to production (producers) is the law of variable proportions. The law states that when a business firm increases one variable factor, keeping the other fixed factors constant, the increase in output is not proportional or not equal to the increase in the quantity of variable input. This law is also known as Law of diminishing returns and was introduced by Prof. Marshall. The law mostly applies in agricultural sector and is applicable only in the short run.

Definition : Marshall has defined the law as below.

“An increase in the amount of labour and capital applied in the cultivation of land causes, in general, a less than proportionate increase in the amount of output raised, unless it happens to coincide with an improvement in the arts of agriculture”.

Assumptions: The law is based on the following assumptions.

  1. It is possible to change some inputs, keeping other factors/inputs constant to increase production.
  2. State of technology or methods of production remain constant.
  3. All units of variable inputs (labour) are homogeneous.
  4. The firm operates in the short period or short run.

The law can be explained with the help of the following table.

Fixed Factor (Land in Acres)Variable FactorTotal ProductAverage ProductMarginal ProductStages of the law operates
51505050Stage I (Increasing Returns)
521206070
531806060
542005020Stage II (Diminishing Returns)
55200400
5618030– 20Stage III (Negative Returns)
5714020– 40

In the table 4.1, it is shown that one input (labour) increases while other factors remain constant results, the proportion varies. Hence, this is known as the law of variable proportions. The table shows the total, average and marginal products change as a result of the change in the proportion between the variable input (labour) and the fixed inputs (land and capital): The production process is categorized into 3 distinct stages.

Graphical Illustration of the Law:

This is explained in the following diagram.

Production Analysis Questions and Answers AP Inter 1st Year Economics Chapter 4 1

Explanation of the graph:

In the above graph (fig), the number of variable factor (Laborers) is shown on the OX-axis and Output (TP, AP and MP) is shown on OY-axis. According to this law, the production behavior can be studied in three stages as identified in the above graph. They are :

1. First Stage : In this stage.

  • The Total Product )TP) curve increases at an increasing rate upto the ponit ‘F’ (Point of Inflexion, where MP is maximum) and then increases at a diminishing rate.
  • The Average Prodcuct (AP) cuve goes on rising throughout the stage and became constant.
  • The Marginal Product (MP) curve first rises and then falls after reaching its maximum, (as shown by point ‘K’ in the figure).
  • The first stage ends when the Average Product is equal to the Marginal Product (AP = MP) and AP is maximum (or) constant.
  • This stage is called as the Law of Increasing Returns.

Reasons : The main reasons for the operation of this stage of production are (a) indivisability of fixed factor, (b) Division of labour and Specialization.

2. Second Stage : In this stage.

  • The total Product (TP) curve increass at diminishing rate and reaches its maximum and constant at POint ‘M’ (Saturation Point).
  • The Aveage Product (AP) curve starts to fall after reaching its maximum (at AP=MP)
  • The Marginal Product (MP) curve continuously falls and becomes zero at the point of saturation i.e., at point ‘M’ (Here, the slope of Total product is zero at point ‘M’).
  • Second stage ends, where total product is at its maximum and marginal product is zero.
  • This stage is called the Law of Diminishing Returns.

3. Third Stage (Law of Negative Returns): In this stage,

  • The total Product (TP) curve falls.
  • The Average Product (AP) curve continues to fall.
  • The marginal Product (MP) curve becomes negative.
  • This stage is called as the Law of Negative Returns.

Conclusion : In all three stages, the producer prefers to operate in stage – II. In this stage, the proper utilisation of resources is possible. The law of variable proportions is a very crucial cocnept which helps the producer to produce at an optimum level.

Importance of Law :

  1. The law helps the business firms / producers to determine the optimum quantities of variable inputs.
  2. The law helps the producers in determining the proportion between fixed input and variable input.
  3. The law is also useful in the rational utilisation of scarce inputs/resources so as to minimise the cost of inputs (production) and to maximise profits/value of output.

Question 2.
Describe the law of return to scale with the help of a diagram.
Answer:
The Law of Returns to Scale, which applies in the long run, shows or explains the relationship between inputs and outputs in the long run. In the short run, to make changes in output, it is not possible to the producer to make changes in all the inputs. He can make changes only in variable inputs, by keeping constant all the fixed inputs. But in the long run, to increase or make changes in output, the producer can also make changes in fixed inputs.

The law of returns to scale explains, how output changes, in the long run, when there is an increase in the quantities of all inputs, both fixed and variable. When all the inputs are increased, the firm will experience three stages, namely the stage of increasing returns, followed by the stage of constant returns, further followed by the stage of decreasing returns.

The law of returns to scale can be explained with the help of table and diagram given below.

Returns to scale:

UnitsCombination of InputsTotalMarginalStages
1.10 Units of labour + 1 unit of capital99Increasing Returns to scale
2.20 Units of labour + 2 units of capital2011
3.30 Units of labour + 3 units of capital3212Constant Returns to scale
4.40 Units of labour + 4 units of capital4412
5.50 Units of labour + 5 units of capital5511Decreasing Returns to scale
6.60 Units of labour + 6 units of capital

Production Analysis Questions and Answers AP Inter 1st Year Economics Chapter 4

Question 3.
Distinguish between internal and external economies of scale and explain them.
Answer:
Nowadays, business firms have a tendency to produce goods on a large scale. They so because when they produce goods on a large scale, they get certain benefits known as economies of scale, also known as economies of large scale production.

Economies of large scale production are of 2 types. They are

  1. Internal Economies,
  2. External Economies.

1. Internal Economies: Internal economies are those economies or advantages which are available only to those firms which expand their size or take up production on a large scale.

2. External Economies : External economies are those economies or advantages which are enjoyed or available commonly to all the firms producing the same product, located at the same place.

Differences :

Internal EconomiesExternal Economies
1) Internal economies are production based or scale or size based economies or benefits.1) External economies are location based economies.
2) They are available only to those units which take up large scale production.2) They are available even to those business units which may not produce on a large scale.
3) Internal economies are not common economies.3) They are the common economies enjoyed by all units in a place.
4) These economies are visible in the form of saving or reduction in costs, larger output, improved quality of the goods, etc.4) These economies are visible or reflected in the form of improved facilities, better infrastructure, tax concessions, etc.
5) Internal economies lead to business rivalry, severe competition, and feeling of enmity among business firms.5) External economies lead to friendship, cooperation, the spirit of give and take, and sharing among business firms.
6) Internal economies, can be compared to the benefit or advantage of textbook reading available to only few textbook reading students in the class.6) External economies can be compared to the benefit of expert teaching by a senior teacher, that is enjoyed by all the students assembled in the class.

Short Answer Questions

Write the answers briefly for the following questions.

Question 1.
Define the internal Economies ? Explain the types of Internal Economies.
Answer:
Internal Economies The word ‘Internal’ is used here to denote the limitation of these economies to the firm itself.

“Internal economies are those which are open to a single factory or a single firm independently of the action of other firms”. – Cairacross.

Types of Internal Economies

Technical Economies : Technical factors affect the returns to scale. Large firms will have more resources at their disposal. They will be able to install the most suitable machinery and adopt to advanced technology. As a result, they can lower cost of production.

Managerial Economies : With the increase in the scale of production, a firm can benefit from separate managerial departments or managers with specialisation. Each department is under the charge of an expert. A small firm can not afford this specialization. Experts are able to reduce the costs of production under their supervision.

Marketing Economies : As the scale of a firm is increased, it obtained economies of purchase and sale. Since the firm purchases on a large scale, it gets all the inputs at a cheaper rate compared to the smaller firms. Similarly wholesalers charge less for the sale of products to a large firm.

Financial Economies : A large firm will be able to reduce its costs of borrowing from the market. A bigger firm is better known to the financial institutions and the stock market. Therefore, a big firm has better access to credit and can borrow on more favourable terms. They can also attract investments.

Risk – bearing Economies : Large firms will be in a position to bear risks or avoid risks. They do so by diversifying output and markets. Therefore, loss in one good or in one market can be covered by profits in other goods and markets.

Question 2.
What are the factors that determine the supply ?
Answer:
Determinants of Supply :
a) Price of a Good : Other things being constant, the supply of a commodity mainly depends on its price. That means, supply of a commodity increases with an increase in its price and vice-versa.

b) Prices of Related Goods: If the price of a substitute good goes up, the producers will be induced to divert their resources to produce that substitute good and vice-versa. For example if the price of pulses increases while the price of rice remains constant, the farmer increases production of pulses and reduces production of rice.

c) Prices of factors of production: Increases in the price of one factor of production would lead to an increase in the cost of production. This results a fall in the profit margin. Consequently, the supply of the commodity will decline. The supply may increase if input prices fall.

d) State of Technology: Discoveries and innovations will help to increase the productivity of the factors and thus contribute to the raising of the supply of a commodity.

e) Government Policy: Imposition of heavy taxes on a commodity discourages its production, and as a result its supply diminishes. On the other hand, providing production subsidies will increase the production as a result its supply will increase.

f) Other factors: Means of transport and communication, goals of the producer, natural factors etc., are also other factors that determine supply of a commodity,

Question 3.
Define Isoquant ? Explain with the help of a graph.
Answer:
Consider a production function with two inputs labour and capital, An Isoquant is the set of all possible combinations of the two inputs that yield the same maximum possible level of output. Each isoquant represents a particular level of output and is labelled with that amount of output.

The shape of isoquant is Convex.

Production Analysis Questions and Answers AP Inter 1st Year Economics Chapter 4 2

Isoquants are also known as equal product lines or producer indifference curves. The reason for slope of IQ curve is diminishing the Marginal Rate of Technical Substitution between two factors say labour & capital (MRTSLK).

We place Labour (L) on the OX axis and Capital (K) on the OY axis. We have three isoquants for the three output levels, namely q = q1, q = q2 and q = q3. Two input combinations (L1, K2) and (L2, K1) given us the same level of output q1. If we fix capital at K1 and increase labour to L3, output increases and we reach a higher isoquant, q = q2. When marginal products are positive, with greater amount of one input, the same level of output can be produced only using lesser amount of the other. Therefore, isoquants are negatively sloped.

Isoquants help the firms in finding the combination of inputs which minimizes the cost of production for a given output. This combination referred to as the “least-cost combination”.

Question 4.
The following table gives the total product schedule of labour. Find the corresponding average product and marginal product schedules of labour.

NLTPL
00
115
238
354
440
535

Answer:
Average Product : Total Product divided by the number of units of labour (NL).
AP = TPL ÷ NL

Marginal Product : Change in Total Product when one more unit of labour is employed.
MP = ∆TPL

NLTPLAP
000 – 0
11515 15 ( 15 – 15)
23819 23 (38 – 15)
35418 16 (54 – 38)
44010 – 14 (40 – 54)
5357 – 5 (35 – 40)

Question 5.
The following table gives the marginal product schedule of labour. It is also given that Total product of labour is zero level of employment. Calculate the total and average product schedules of labour.

L123456
MPL3575– 5– 7

Answer:

LMPLTPAP
1333 (3 ÷ 1)
2584 (8 ÷ 2)
37155 (15 ÷ 3)
4– 5203 (15 ÷ 3)
6– 781.33 (8 ÷ 6)

Question 6.
Write the assumptions of the Law of Variable Proportions.
Answer:

  1. The law operates in the short run.
  2. The technique of production remains constant.
  3. All the units of variable factors are homogeneous.
  4. It is possible to use various quantities of a variable factor in combination with fixed factors of production. In other words, the proportion between the factors can be changed.

Quantities 7.
Write the Law of Returns Scale Assumptions.
Answer:

  1. The law relates to long run.
  2. In long run, all inputs are variable.
  3. State of technology remains the same.
  4. Existence of perfect competition.

Question 8.
Write a short note on change in quantity supplied.
Answer:
When supply changes due to a change in its price, other factors remaining constant, it is called change in quantity supplied. It is also called expansion and contraction in supply. In this case, there will be a movement along the same supply curve. This can be shown in the following diagram.

Quantity supplied of commodity is changed due to change in price. An upward movement (right side) from the point A to B is called expansion and a downward (left side) movement from the point A to C is called contraction in supply.

Question 9.
Briefly discuss the change in supply.
Answer:
Supply may increase or decrease at the same price, if there is a change in the other factors determining the supply. In such situations, the supply curve shifts.

Supply is said to increase (right ward shift) when more quantity is offered for sale at the same price. Supply is “said to decrease (left ward shift), when at the same price, less is offered for sale. This is illustrated by the following diagram.

From the figure, suppose SS is the supply curve at OP price. S2S2 shows decrease in supply because at the same price OP, less is offered for sale i.e., OM2. S1S1 shows increase in supply at the same price i.e., OM1. These shifts in supply curve are due to change in other determinants of supply, except price.

Production Analysis Questions and Answers AP Inter 1st Year Economics Chapter 4

Question 10.
Mention the types of Price elasticity of supply.
Answer:
The price elasticity of supply is the degree of responsiveness of quantity supplied to changes in the price of the good. More specifically, the price elasticity of supply, denoted by es, is defined as follows,
es = \(\frac{Percentage change in quantity supplied}{Percentage change in price}\)
= \(\frac{\frac{\Delta Q}{Q} \times 100}{\frac{\Delta P}{P} \times 100}\)
= \(\frac{\Delta Q}{\Delta P} \times \frac{P}{Q}\)
∆Q = Change in quantity of the good supplied;
∆P = Change in price,
P = Original price,
Q = Original quantity.

Note: The price elasticity of supply value ranges between 0 & ∞.

Types of price elasticity of supply: On the basis of responsiveness of supply due to change in price, there are five types of price elasticity of supply. They are;

  1. Perfect elastic supply (es = ∞)
  2. Perfect inelastic supply (es = 0)
  3. Unitary elastic supply (es = 1)
  4. Relative elastic supply (es > 1)
  5. Relative inelastic supply (es < 1)

Very Short Answer Questions

Question 1.
Production Function.
Answer:
The term production function shows or refers to the technical (or mathematical / functional) relationship between the physical quantities of inputs and physical quantity of output. It always refers to a period of time and assumes that there is no change in technology.
Q = f (N, L, K, O) where
Q = Quantity of output,
N, L, K, Q = Quantities of inputs.

Question 2.
Two characteristics of Labour.
Answer:

  1. Labour is inseparable from the labourer and exhausts if not used.
  2. Labour supply is variable.
  3. It varies in quality from person to person.
  4. Labour has mobility.

Question 3.
Entrepreneur.
Answer:
The fourth factor of production is entrepreneur. It is not enough to say that production is a function of land, labour and capital. There must be someone to mobilize all these factors, combine them in the right proportion, initiate the production process, and bear the associated risks. The person who organises production is known as the entrepreneur. He is also called the organiser. According to Schumpeter, the true function of an entrepreneur is to introduce innovations”. He is the one who is prepared to bear the risk.

Question 4.
Two sources of Capital Formation.
Answer:
Two sources of capital formation are savings and investment. Savings can come from households, businesses and the government and are used for investment purposes, often in the form of purchasing stocks and bonds issued by corporation.

Question 5.
Cobb Douglas Production Function.
Answer:
It was developed by Paul H. Douglas and C.W. Cobb. It applies not to be an individual firm but to the whole of manufacturing industries in US. It considers output as manufacturing production and inputs used are labour and capital. It is stated as follows :
Q = AKaLb
Where Q = output
L = Quantity of Labour
K = Quantity of capital
A and a are positive constants.

Question 6.
Diagram showing AP and MP curves.
Answer:

Production Analysis Questions and Answers AP Inter 1st Year Economics Chapter 4 3

Question 7.
Second stage in the Law of variable proportions.
Answer:
Second stage : In this stage,

  1. The Total Product (TP) curve increases at diminishing rate and reaches its maximum and constant at Point ‘M’ (Saturation Point).
  2. The Average Product (AP) curve starts to fall after reaching its maximum (at AP = MP).
  3. The Marginal Product (MP) curve continuously falls and becomes zero at the point of saturation i.e., at point ‘M’. (Here, the slope of Total product is zero at point ‘M’).
  4. Second stage ends, where total product is at its maximum and marginal product is zero.
  5. This stage is called the Law of Diminishing Returns.

Question 8.
Law of Supply.
Answer:
The law of supply explains the functional relationship between price of a commodity and its quantity supplied. “Other things remaining the same, as the price of a commodity rises, its supply is extended, and as the price falls, its supply is contracted”.

The quantity offered for sale varies directly with price i.e. the higher the price the larger is the supply and vice-versa.

Production Analysis Questions and Answers AP Inter 1st Year Economics Chapter 4

Question 9.
Elasticity of Supply.
Answer:
The price elasticity of supply is the degree of responsiveness of quantity supplied to changes in the price of the good. More specifically, the price elasticity of supply, denoted by es, is defined as follows,

es = \(\frac{Percentage change in quantity supplied}{Percentage change in price}\)
= \(\frac{\frac{\Delta \mathrm{Q}}{\mathrm{Q}} \times 100}{\frac{\Delta \mathrm{P}}{\mathrm{P}} \times 100}\)
= \(\frac{\Delta \mathrm{Q}}{\Delta \mathrm{P}} \times \frac{\mathrm{P}}{\mathrm{Q}}\)
Where, ∆Q = Change in quantity of the good supplied;
∆P = Change in price,
P = Original price,
Q = Original quantity.

Note: The price elasticity of supply value ranges between 0 & ∞.

One Word Answer Questions

Answer the following questions in ONE WORD.

Question 1.
The responsiveness of quantity supplied due to change in price of a good is called:
Answer:
Elasticity of supply

Question 2.
The set of all possible combinations of two inputs that yield the same maximum possible level of output is known as :
Answer:
Isoquant

Question 3.
Which factor of production has been rightly defined as Produced means of production ?
Answer:
Capital

Question 4.
Under the law of variable proportions, at point of inflexion, marginal product is :
Answer:
Maximum

Question 5.
The economies that occurred to each member firm as a result of the expansion of the industry as a whole are known as …………….
Answer:
External economies

Fill in the blanks

Question 1.
When total product is 10 units and units of variable factor are 5, the average product will be ___________
Answer:
Units

Question 2.
When TP becomes constant at its maximum, MP is equal to ___________
Answer:
Zero (0)

Question 3.
When the supply curve shifts to right side, it is called ___________
Answer:
Increase in supply

Question 4.
In short-run when average product increases, marginal product is ___________
then average product.
Answer:
Greater then average product

Production Analysis Questions and Answers AP Inter 1st Year Economics Chapter 4

Question 5.
When percentage change in output is greater than percentage change in inputs, it is called ___________
Answer:
Increasing returns to scale

Multiple Choice Questions

Question 1.
The Law of Variable Proportions when MP = AP, then AP is :
1) Maximum
2) Minimum
3) Negative
4) Zero
Answer:
1) Maximum

Question 2.
The behaviour of output due to change in all inputs is studied by :
1) The Law of Variable Proportions
2) The Law of Diminishing Returns
3) The Law of returns to scale
4) The law of returns to a factor
Answer:
3) The Law of returns to scale

Question 3.
In Cobb-Douglas production function, when a + b = 1, it exhibits.
1) Increasing return to scale
2) Constant return to scale
3) Decreasing return to scale
4) Negative return to scale
Answer:
2) Constant return to scale

Question 4.
Isoquant measures.
1) Marginal rate at technical situation between labour and capital
2) Marginal rate of substitution between two goods
3) Marginal utility of money
4) Marginal Efficiency of capital
Answer:
1) Marginal rate at technical situation between labour and capital

Question 5.
The stage of actual production in the law of returns to scale:
1) Increasing returns to scale
2) Constant returns to scale
3) Diminishing returns to scale
4) Negative returns to scale
Answer:
2) Constant returns to scale

Theory of Demand Questions and Answers AP Inter 1st Year Economics Chapter 3

Regular practice with AP Inter 1st Year Economics Study Material Chapter 3 Theory of Demand Behaviour Questions and Answers helps students stay prepared for examinations.

AP Inter 1st Year Economics 3rd Lesson Theory of Demand Questions and Answers

Essay Questions

Write an essay on the following questions.

Question 1.
Distinguish between income demand and cross demand with the help of diagrams.
Answer:
Income demand explains the relationship between a consumer’s income and various quantities of goods and services demanded at various levels of income, assuming that other factors remain constant. These factors include the price of the good, the price of related goods, tastes, preferences, etc., Symbolically, the functional relationship between income and demand is shown below.
Dx = f(Y)
Where; Dx = Demand for good X,
Y = Income of a consumer,
f = Functional relationship

This means the quantity demanded of good X is a function of the consumer’s income. The functional relationship between income and quantity demanded may be inverse or direct depending on the nature of the commodity.

Table : Income Demand Schedule

Income

(Rs.)

Demand
Superior Goods (Kgs.) /(Units)Inferior Goods (Kgs.)
2000412
4000610
600088
8000106
10000124

Income Demand Schedule:

An income demand schedule is a list of various quantities of commodities of both superior and inferior goods purchased at different levels of income.

Table shows the relationship between various levels of income and the quantities demanded for both superior and inferior goods. Whenever income increases, the demand for superior goods increases and the demand for inferior goods decreases and vice versa.

Superior / Normal Goods:

In the case of superior or normal goods, such as cereals, pulses, home appliances etc., demand increases when there is an increase in the income of consumers. The income demand for superior goods exhibits a positive relationship between income and demand.

In Fig., the OX-axis represents the demand for superior goods and the OY-axis represents the income of the consumer. YD represents the income demand curve, showing a positive slope. Whenever income increases from OY to OY1 the demand for superior or normal goods increases from OQ to OQ1 and vice versa.

Theory of Demand Questions and Answers AP Inter 1st Year Economics Chapter 3 1

Inferior Goods:

In the case of inferior goods such as ragi, bajra, and broken rice etc., demand decreases with an increase in the income of consumers. The income demand for inferior goods exhibits an inverse relationship between income and demand.

In Fig., the OX-axis represents the demand, and the OY-axis represents the income of the consumer. YD is the income demand curve for inferior goods, which has a negative slope.

When the consumer’s income increases from OY to OY1 the demand for the commodity decreases from OQ to OQ1 and vice versa.

Theory of Demand Questions and Answers AP Inter 1st Year Economics Chapter 3 2

Cross Demand:

Cross Demand refers to the relationship between any two goods that are either complementary or substitutes for each other. It indicates the quantity of goods demanded when the price of its substitute or complementary goods changes. In short, when other factors remain constant, the functional relationship between the quantity demanded of a commodity and the price of another commodity is called cross demand.

Symbolically,
Dx = f (Py)
Where;
Dx = Demand for ‘X’ commodity,
Py = Price of ‘Y’ commodity,
f = Functional relationship

Substitute Goods:

Substitutes are goods that satisfy the same want. For example tea and coffee, pepsi and coca-cola etc.

Table : Schedule for Substitutes
CoffeeTea
Price
(in Rs.)
Demand
(Cups)
Price
(in Rs.)
Demand
(Cups)
1050010500
960010400

Table shows a positive relationship between the price of coffee and the demand for tea. If the price of coffee decreases, while the price of tea remains constant, then the demand for tea decreases, especially if the existing price of tea is higher than the new price of coffee. In such cases, consumers shift their demand from tea to coffee. Similarly, if the price of coffee increases, while the price of tea remains constant, the demand for tea increases. Hence, in the case of substitutes, the demand curve has a positive slope i.e. it slopes upward from left to right.

In Fig., the OY-axis represents the price of coffee and the OX-axis represents the demand for tea. An increase in the price of coffee from OP to OP2 leads to an increase in the demand for tea from OQ to OQ2. Hence, in the case of substitute goods the demand curve slopes upward from left to right.

Theory of Demand Questions and Answers AP Inter 1st Year Economics Chapter 3 3

Complementary Goods:

Complementary goods are those goods that satisfy the same want jointly. For instance, cars and fuel, shoes and socks, bread and butter, lock and key etc.

Table : Schedule for Complementary goods
FuelCars
Price
(in Rs.)
Demand
(Lts)
Price
(in Lakhs)
Demand
(Units)
1005000101000
7510000102000

Table shows an inverse relationship between the price of cars and the demand for fuel. If the price of fuel decreases, the demand for cars increases, with the prices of cars remaining constant.

In Fig., the price of fuel is shown on the OY-axis and the demand for cars is shown on the OX-axis. If the price of fuel decreases from OP to OP2 the demand for cars may increase from OQ to OQ2 and vice versa. The cross demand curve for complementaries slopes downward.

So far, we have discussed important aspects of the theory of demand. Now we will proceed to learn the concept of ‘elasticity of demand’ comprehensively.

Question 2.
Which method of measuring price elasticity of demand do you consider most useful ? Explain your answer.
Answer:
The percentage (or proportionate) method of measuring price elasticity of demand is considered the most useful and widely used. This method calculates elasticity using the following formula :

\((P E D)=\frac{\% \text { Change in Quantity demanded }}{\% \text { Change in Price }}\)

Reasons why this method is most useful :

  1. Simple and clear : It directly relates the percentage change in quantity demanded to the percentage change in price, making it easy to understand and apply in real world situations.
  2. Widely applicable : It can be used across different types of goods and services, regardless of units or currency, making comparisons straight forward.
  3. Helps decision-making : Businesses and policy-makers often rely on
    percentage changes to forecast consumer behaviour, set prices or assess tax impacts, making this method practical and relevant.
  4. Flexible : It can be adopted into the mid point formula for more accurate elasticity between two points, reducing bias depending on the direction of change.

Question 3.
Explain the concepts of income elasticity and cross elasticity of demand.
Answer:
Income elasticity of demand and cross elasticity of demand are both important economic concepts that help understand consumer behaviour in response to changes in income and prices respectively.

Income Elasticity of Demand (IED) :
Definition : Income elasticity of demand measures how the quantity demanded of a good responds to a change in consumer’s income.

\(\mathrm{IED}=\frac{\% \text { Change in Demand }}{\% \text { Change in Income }}\)

Interpretation :

  1. IED > 1 : The product is a luxury good. A 10% increase in income may result in more than a 10% increase in the quantity demanded,
  2. IED < 1 The product is a necessity. A 10% increase in income may result in less than a 10% increase in the quantity demanded.
  3. IED = 0 : The demand for the product is perfectly inelastic to income.
  4. IED < 0 : The product is an interior good. Higher income leads to a decrease in demand.

Example : If the income of consumers, increases by 5% and the demand for branded clothes increases by 10% the IED would be 2 (luxury). Cross

Elasticity of Demand (CED) :

Definition : Cross elasticity of demand measures how the quantity demanded of one good respond to a change in the price of another good. Formula :

\(C E D=\frac{\text { Percentage Change in Quantity Demand of Good A }}{\% \text { Change in Price of Good B }}\)

Interpretation :

  1. CED > 0 : The goods are substitutes. An increase in the price of Good B will increase the demand for Good A (Eg: Tea and Coffee).
  2. CED < 0 : The goods are complements. An increase in the price of Good B will decrease the demand of Good A (Eg: Cameras and memory cards)
  3. CED = 0 : The goods are unrelated changes in the price of Good B do not affect the demand for Good A.

Example : If the price of coffee increases by 5% and the demand of tea increase by 2%, the CED is 0.4 indicating that tea and coffee are substitutes.

The concepts of income elasticity and cross elasticity of demand provide valuable insights into pricing strategies, consumer preferences, and market dynamics. Understanding the elasticity of demand helps businesses and policymakers make informed decisions regarding product pricing, supply chain adjustments and taxation impacts.

Theory of Demand Questions and Answers AP Inter 1st Year Economics Chapter 3

Question 4.
Explain the Law of Demand and examine exceptions for it.
Answer:
Demand is the desire accompanied by ability and willingness to buy the product. “By demand, we mean the various quantities of a given commodity or service, which consumers would buy in one market in a given period of time at various prices of the good” – Bober.

“The law of demand states that there is an inverse or opposite relationship between price and quantity demanded, other things remaining the same. The law states that demand curves slopes downwards from left to right. ”

Definition: “Other things being equal, the quantity demanded expands with fall in price and contracts with a rise in price. – Samuelson.

Determinants of demand : The demand for a product depends upon various factors. They are price of the products, income of consumer, prices of related goods, the habits of the consumers, advertising expenditure of the firm, etc. The functional or mathematical relationship between determinants of demand and demand of a good is known as demand function.

DA = f(Pa, y, Pr, T, A)
DA = Demand of product A
PA = Price of A
Y = Income of the consumer
Pr = Price of related goods
T = Tastes of the consumer
A = Advertising expenditure

Assumptions of Law of Demand : The Law of demand is based on a number of assumptions.

  1. There are no changes in the tastes and fashions of the consumers.
  2. People’s incomes are constant.
  3. The prices of related products remain the same.
  4. There are no substitutes to the product.
  5. There is no possibility of price changes in future.

Demand Schedule : Demand schedule is a table which shows different prices of the good and quantities demanded of the good at those prices. It is of two types. They are

  1. Individual demand schedule,
  2. Market demand schedule
Price of Apply (Rs.)Quantity Demand (Kg)
53
47
312
218
125

The above table shows than when the price is high (Rs. 5) quantity is demanded is less and when price is low (Re. 1). quantity demanded is more.

Demand Curve: Demand curve can be shown diagramatically with the help of demand schedule.

Theory of Demand Questions and Answers AP Inter 1st Year Economics Chapter 3 4

In the adjacent diagram when the price is OP, the demand is OM. When the price has decreased from OP to OR demand has expanded from OM to ON. In other words, the above diagram shows that demand curve slopes downwards from left to right.

Exceptions to the Law of Demand :

  1. Giffen goods : The law of demand is not applicable to Giffen goods. In the case of Giffen goods, a fall in their price leads to a decrease in demand.
  2. Veblen Goods (Prestige goods) : The law of demand will not apply in the case of costly products purchased by rich people. If the price of costly diamonds purchased by rich people increases, the demand for such diamonds also increases.
  3. Speculation : If the price of the good is increasing and likely to increase further in future, speculators purchase larger quantity even at a higher price.
  4. Illusion : Some consumers, with wrong illusion, purchase less quantity of a good whose price has decreased with the wrong illusion that quality has also been reduced.

Quantity 5.
Define the concept of Elasticity of Demand and explain the concept of price, Income and cross Elasticity of Demand.
Answer:
The degree to which quantity demanded responds to a change in price is known as elasticity of demand.

In other words “The elasticity of demand is the ratio of the percentage change in the quantity demanded and the percentage change in price”.

Mathematically, it can be expressed as

Price Elasticity of Demand PEd = \(\frac{Proportionate Change in Quantity Demand}{Proportionate Change tn Price}\)

Elasticity of Demand studies the relationship between proportionate or percentage change in demand and proportionate or percentage change in price. It is of 3 types.

1. Price elasticity of demand : Price elasticity of demand studies the relationship between proportionate change in price and proportionate change in demand. It explains the rate of change in demand for a given change in the price of commodity.

Price elasticity of demand (PEd) = \(\frac{Percentage of Proportionate Change in Demanded}{Percentage of Proportionate Change in Price}\)

Price elasticity demand is of five types. They are :

  1. Perfectly or infinite elastic demand (Ed = ∞)
  2. Perfectly inelastic demand (Ed = 0)
  3. Unitary elastic demand (Ed = 1.
  4. Relatively elastic demand (Ed > 1.
  5. Relatively inelastic demand (Ed < 1.

2. Income elasticity of demand: Income elasticity of demand explains the relationship between percentage proportionate change in demand and percentage, proportionate change income.

Income elasticity of demand (LH) = \(\frac{Percentage or Proportionate Change in Demanded}{Percentage or Proportionate Change in Income}\)

Income elasticity of demand is positive for normal goods. But in the case of inferior goods, income elasticity of demand is negative.

3. Cross elasticity of demand : Cross elasticity of demand studies the relationship between percentage or proportionate change in demand of product (E.g : Coffee) because of a percentage or proportionate change in price of another related good. (E.g: Tea)

Cross elasticity of demand CrEd = \(\frac{Percentage or Proportionate Change in Demand of Coffee}{Percentage or Proportionate Change in Price of Tea}\)

Related goods are of two types. They are

  1. Substitutes and
  2. Complementary goods.

Theory of Demand Questions and Answers AP Inter 1st Year Economics Chapter 3

Quantity 6.
What is Price Elasticity of Demand ? Explain the various types of Price – Elasticity of Demand.
Answer:
The degree to which quantity demanded responds to a change in price is, known as elasticity of demand.

In other words, the elasticity of demand is the ratio of the percentage change in the quantity demanded to the percentage change in price.

Mathematically, it can be expressed as price elasticity of demand (E) = PEd = \(\frac{Proportionate change in quantity demand} {Proportionate change in price}\)

1. Price elasticity of demand: It shows the relationship between percentage of change in quantity demanded and percentage change in price.

Elasticity of demand (PEd) = \(\frac{Proportionate Change in Demand }{proportionate Change in Price}\)

Types of price elasticity of demand: Basing on the percentage change in demand and percentage change in price, price elasticity of demand can be divided into following.

a) Perfectly elastic or Infinite elastic demand :
A product will have perfectly elastic demand when demand changes infinitely due to slight change in price or no change in price. Demand is also said to be perfectly elastic, when infinite quantity can be purchased at the same price.

In the given diagram, demand has increased from OM to ON, even though there is no change in price. The demand curve is horizontal straight line parallel to X – axis so, Ed = ∞

Theory of Demand Questions and Answers AP Inter 1st Year Economics Chapter 3 5

b) Perfectly Inelastic or Zero elastic demand :
If the demand for a product does not change even though price changes many times, such demand is called as perfectly inelastic demand.

In the adjacent diagram, even though price has increased from OP to OP1, there is no change in demand (OM). The demand curve is vertical straight line parallel to Y – axis. so, Ed = 0.

Theory of Demand Questions and Answers AP Inter 1st Year Economics Chapter 3 6

c) Relatively elastic demand :
If the proportionate or percentage change in demand is more than the proportionate or percentage change in price, it ‘is called as relatively elastic demand. Such a demand curve is more flater so, Ed > 1.
In the adjacent diagram, when the price has decreased from OP to OP1, the increase in the demand is OM to OM1 Increase in demand (M, M1) is more than change in price PP1 So Ed > 1.

Theory of Demand Questions and Answers AP Inter 1st Year Economics Chapter 3 7

d) Relatively inelastic demand : When the proportionate or percentage change in demand is less than proportionate or percentage change in price, it is called as relatively inelastic demand. Such demand curve is more steeper.

In the adjacent diagram, when the price has increased from OP to OP1, the demand has decreased from OM to OM1. The amount of change in price (PPX) is more than the amount of change in demand (MM1). So Ed < 1.

Theory of Demand Questions and Answers AP Inter 1st Year Economics Chapter 3 8

e) Unitary elastic demand: When the proportionate or percentage change in demand is equal to proportionate or percentage in price, it is called unitary elastic demand.

In the adjacent diagram, when the price has decreased from OP to OP1 demand has increased from OM to OM1. The amount of change in demand M, M1 is equal to the amount of change in price P, P1. So, Ed = 1.

Theory of Demand Questions and Answers AP Inter 1st Year Economics Chapter 3 9

Short Answer Questions

Question 1.
Mention any four factors that determine demand with examples.
Answer:
There are a number of factors that determine the demand for a good. The following are some of the important factors that determine demand.

1. Price of the Commodity (Px) : The demand for a commodity is ordinarily inversely related to its price. If t he price of a commodity falls, its demand increases and vice versa, assuming other things remaining constant. Thus, the price of the commodity is an important determinant of its demand.

2. Prices of Substitutes and Complementaries (Pr) : Demand for a commodity is also influenced by the prices of its substitutes or complementaries. Tea and coffee are substitute goods. For instance, an increase in the price of coffee leads to an increase in the demand for tea and vice versa. In the case of substitutes, there exists a positive relationship between price and demand. Automobiles and fuel are complementary goods. If the price of fuel falls the demand for automobiles increases and vice versa. In the case of complementaries there exists a negative relationship between the price and the demand.

3. Income of the Consumer (Y): The income of the consumer is another important determinant of demand. Assuming other things remain constant, whenever the income of a consumer increases, the demand for normal goods increases and the demand for inferior goods decreases.

4. Tastes and Preferences (T) : The demand for a commodity may change due to changes in tastes, preferences, and fashion. Tastes vary from person to person and tastes do not remain the same forever. For instance, an increase in the use of trousers reduced the demand for dhotis due to a change in fashion. Advertisements also influence demand for particular commodities.

Quantity 2.
Do you agree with the law of demand? Explain your answer.
Answer:
Yes, I agree with the law of demand. It is a fundamental principle in economics that describes pretty consistent and logical relationship between the price of a good or service and the quantity of it that consumers are willing and able to purchase.

Essentially, the law of demand states that as the price of a good or service increases, the quantity demanded will decrease, all other thing being equal. Conversely as the price decreases, the quantity demand will increase.

Here is why this relationship generally hold true :

  1. Income Effect : When the price of a good falls, consumers have more purchasing power with their existing income. This allows them to buy more of that good, as well as potentially other goods and services.
  2. Substitution Effect: When the price of a good rises, consumers may look for cheaper alternatives or substitutes.
    For example, if the price of coffee goes up significantly, some people might switch to tea.
  3. Diminishing Marginal Utility : The principle suggests that the additional satisfaction, a consumer gets from consuming one more unit of a good decreases with each additional unit consumed. Therefore, consumers are generally willing to pay less for each additional unit.
  4. Increased Affordability : Lower prices make goods and services more affordable to a wider range of consumers, leading to an increase in overall demand.

In short, the law of demand provides a valuable framework for understanding how market’s function and how consumers respond to price changes. It is a cornerstone of economic analysis and has significant implication for businesses and policy makers like.

Quantity 3.
Why does a demand curve have a negative slope or downward slope from left to right?
Answer:
The law of demand states that there is an inverse or opposite relationship between the price and quantity demanded. In other words, demand curve slopes downwards left to right.

Reasons for the downward slope or demand curve: Demand curve slopes downwards because of the following reasons.

a) New buyers : Demand curve slope downwards because when price falls new buyers are attracted to the product or new buyers will also purchase the product.

b) Old buyers : When the price decreases old buyers purchases more quantity than before. So, demand curve slopes downwards.

c) Income effect : When a price of a product decreases, there will be saving in expenditure to the consumers. This saving can be treated just like an increase in the income. In other words, real income of the consumer increases. So, the consumer purchases more quantity of good whose price has decreased.

d) Substitution effect : When the price of a good (tea) decreases, the other related product (coffee) becomes relatively costlier. So consumer purchases more quantity of tea and less quantity of coffee, which has become relatively costlier.

e) Law of diminishing marginal utility : Demand curve slopes downwards from left to right also because of this law. According to the law, when the consumers are using continuously additional units of the same product, the marginal utility of additional units gradually decreases. So, at smaller quantity, consumer is prepared to pay higher price. But at larger quantities, he is prepared to pay a lower price because there he gets lesser marginal utility.

f) Multiple uses of a commodity : Goods like coal, milk, electricity have multiple uses. When prices of such goods decrease, consumers use such goods to more uses than before.

Quantity 4.
Distinguish between relatively elastic demand and relatively inelastic demand with numerical examples.
Answer:
Relatively elastic demand and relatively inelastic demand describe how much the quantity demanded of a good or service changes in response to a change in its price. The key difference lies in the degree of responsiveness.

Relatively Elastic Demand :

Definition : Demand is considered relatively elastic when a small percentage change in price leads to a larger percentage change in the quantity demanded. Consumers are quite sensitive to price changes for these goods.

Numerical Value : The price elasticity of demand coefficient (Ed) is greater than 1 (Ed > 1).

Numerical example of Relatively Elastic Demand : Suppose the price of a popular brand of coffee decreases by 5% and as a result the quantity demanded increases by 15%.

Percentage change in price = – 5%
Percentage change in quantity demanded = + 15%

The price elasticity of demand (Ed) would be calculated as :
Ed = \(\frac{Percentage change in quality demanded}{Percentage change in price}\)
= \(\frac{15 %}{- 5 %}\) = – 3 %

The absolute value of Ed is | – 3 | =3 which is greater than 1. This indicates that the demand for this brand of coffee is relatively elastic. A small decrease led to proportionally larger increase in quantity consumers wanted. Example of goods with relatively elastic demand often include luxury goods, goods with many close substitutes, and goods that represent a significant portion of a consumer’s budget.

Relatively Inelastic Demand :

Definition : Demand is considered relatively inelastic when a large percentage change in price leads to a smaller percentage change in the quantity demanded. Consumers are not very sensitive to price changes for these goods.

Numerical value : The price elasticity of demand coefficient (Ed) is less than 1 (1 Ed / < 1).

Numerical Example of Relatively inelastic demand : Consider the price gasoline increasing by 10% and as a consequence, the quantity demanded decrease by only 2%.
Percentage change in price = + 10%.
Percentage change in quantity demanded = – 2%
The price elasticity of demand (Ed) would be
Ed = \(\frac{Percentage Change in Quantity Demanded}{Percentage Change in Price}\)
= \(\frac{- 2 %}{10 %}\) = – 0.2 The absolute value of Ed is | – 2 | = 0.2 which is less than 1.

This shows that the demand for gasoline in this scenario is relatively inelastic. Even with a significant price increase, the quantity demanded did not decrease by a large proportion. Goods with relatively inelastic demand are often necessities, goods with few close substitutes, or goods that represent a small portion of consumers’ budget.

Theory of Demand Questions and Answers AP Inter 1st Year Economics Chapter 3

Question 5.
Calculate the price elasticity of demand with the help of the point method.
Answer:
Price elasticity of demand shows the responsiveness of quantity demanded to changes in price. In other words, it is the ratio proportionate of percentage change in quantity demanded and proportionate (percentage) change in price.

Theory of Demand Questions and Answers AP Inter 1st Year Economics Chapter 3 10

Point method : This method was suggested by Alfred Marshall. Under this method, the elasticity of demand at a point can be calculated measured by dividing the (length of) lower segment of the demand curve with the (length of) upper segment of the demand curve. To calculate elasticity of demand, a point is placed on the demand curve and such point divides the demand curve into two parts, namely, a lower part and an upper part.

1. In the given diagram, at the middle point of the demand curve (K) PEd = 1. This is because at point K lower segment (KB) is equal to upper segment of the demand curve (KA). \(\frac{\mathrm{KB}}{\mathrm{KA}}\) = 1, Ed = 1.

2. At a point above the middle point (G), Price elasticity of demand is greater than one (Ed > 1.. This is because at point G, the lower part of the demand curve, GB is more than the upper segment/part of the demand curve (GA).
GB > GA. PE > 1. \(\frac{\mathrm{GB}}{\mathrm{GA}}\) = more than one.

3. At a point below the mid point of the demand curve, price elasticity of demand is less than one. This is because at profit L, the length of the lower segment of the demand curve (LB) is less than the length of the upper part of the demand curve (LA).
\(\frac{\mathrm{LB}}{\mathrm{LA}}\) = less than one PEd < 1.

Question 6.
What are the factors that determine the price elasticity of demand ?
Answer:
The following are some of the factors that determine the demand for a good.

  1. Price of the good : The most important determinant of demand of any good is the price. Price and demand are inversely related. If price increases, demand contracts and if price decreases demand expands.
  2. Prices of related goods (Substitutes & Complementary goods) : Demand for a good depends not only on its price but also on the prices of substitutes and complementary goods. If the price of tea (substitute of coffee) decreases, demand for coffee decreases. In the same way, when the price of jam increases (complementary good of bread) demand for the jam decreases.
  3. Income of the consumer : Another important determinant of demand is the income of the consumer. Income and demand are directly related. If income increases demand increases and vice versa.
  4. Tastes and preferences : A change in the tastes and preferences of the consumer leads to a change demand for goods. A change in the preference
    and tastes of the consumer towards cell phones results in a fall in the demand for landline phones.
  5. Population : The size of population of the country is another determinant of demand. If population increases, demand for many goods increases.
  6. Technology changes : An improvement in technology, by leading an improvement in quality and reduction cost of production and selling price, leads to an increase in demand for goods.
  7. Changes in weather conditions : Demand for a good is also determined by weather conditions. Air conditioners, cool drinks, etc. will have higher demand during summer. The demand for woollen clothes increases during winter.
  8. State of Business : In a period of Economic depression, demand for goods contracts and in a period of Economic property, the demand for goods increases.

Question 7.
Explain any four points on the importance of price elasticity of demand.
Answer:
Elasticity of demand shows the ratio of proportionate or percentage change in quantity demanded to proportionate or percentage or change in price. Elasticity of demand is having a number of uses.

  1. Finance minister : Finance minister uses elasticity of demand for imposing taxes on different goods. He imposes higher (more) taxes on goods having inelastic demand and less taxes on goods having elastic demand.
  2. Monopolist: Elasticity of demand is also useful in determining price in monopoly. Monopolist charges higher price in that sub – market where the product is having inelastic demand. He charges a lower price in that sub – market where the product is having elastic demand.
  3. Useful in factor pricing : Elasticity of demand is also useful in fixing the rewards or prices of factors of production. Factors having inelastic demand will get higher price than factors having elastic demand.
  4. International trade : The concept is also useful in international trade. It helps in determining terms of international trade, tariff policy and foreign exchange rates.
  5. Nationalisation of Industries : The concept also helps the government in making of decisions about nationalisation of industries. The government nationalises those industries whose products are having inelastic demand. E.g : Elasticity, post and telegraphs, etc.
  6. Pricing of Joint products : In the case of joint products, it is not easy to know their separate cost of production. Their prices are fixed basing on elasticity and inelasticity of such products.
  7. Granting of protection : Government grants protection to industries basing elasticity of demand. It gives protection to industries or goods having elastic demand.
  8. Helps in fixing prices of goods and services of government sector : If the products and services of public sector units are having inelastic demand, higher prices are fixed. If they have elastic demand, lower prices are fixed for them.

Question 8.
Explain the concept of Income Demand.
Answer:
Income Demand shows the functional relationship between a change in the income of the consumer and a change in quantity demanded.
ID = f (y)
ID = Income Demand,
y = Income of the Consumer,
f = function.
Income demand curves is of 2 types.

i) Normal goods : In the case of Normal goods an increase in the income of the consumer leads to an increase in the quantity purchased of such good. Income demand curve for normal goods slope upwards from left to right as shown below.

Theory of Demand Questions and Answers AP Inter 1st Year Economics Chapter 3 11

ii) Inferior goods : In the case of inferior goods, an increase in the income of the consumer leads to a decrease in the quantity purchased of the good. Income demand curve for Inferior goods slopes downwards from left to right as shown below.

Theory of Demand Questions and Answers AP Inter 1st Year Economics Chapter 3 12

Question 9.
Explain the concept of Cross Demand.
Answer:
Cross Demand shows the functional relationship between the change in the price of one good (coffee) and change in the demand of its related good (Tea).
Dc = f (Pt)
Dc = Demand for coffee,
Pt = Price of tea,
f = function.

Cross Demand curve is of two types – either upward sloping or downward sloping.

Substitutes:
Substitutes are those goods that are used in the place of some other good. E.g: Coffee & Tea. If there is an increase in the price of coffee, demand for tea increases. Cross Demand Curve for substitute slopes upwards from left to right as shown below.

Theory of Demand Questions and Answers AP Inter 1st Year Economics Chapter 3 13

Complementary goods: Complementary goods are two or more goods used by the consumer simultaneously to satisfy the same want. E.g: Bread and jam. If the price of bread increases, the demand for jam decreases.

Cross Demand curve for complementary goods slopes downwards as shown below.

Theory of Demand Questions and Answers AP Inter 1st Year Economics Chapter 3 14

Theory of Demand Questions and Answers AP Inter 1st Year Economics Chapter 3

Question 10.
Explain the Total outlay Method of Measuring Elasticity of Demand.
Answer:
The degree of sensitiveness or responsiveness of demand to a change in the price of a good is known as (price) elasticity of demand. In the words, elasticity of demand is the ratio of the percentage or proportionate change in the quantity demanded and proportionate or percentage change in the price.

Outlay Method : (Expenditure Method): This method is associated with the name of Alfred Marshall. Under this method, elasticity of demand of a good can be calculated or measured by finding out whether the expenditure made on the good increases, decreases or remains constant with a change in the price of the good.

Theory of Demand Questions and Answers AP Inter 1st Year Economics Chapter 3 15

In the above diagram, on Y – axis price is shown and on X – axis is outlay or expenditure made is shown.

  1. When the price has decreased 1st time from Rs. 4 to 3, the outlay expenditure made on the good has increased from Rs. 4000 to Rs. 6000. If a decrease in the price leads to an increase in expenditure (vice versa), the good will have (relatively) elastic demand. (Ed > 1).
  2. When the price has decreased, 2nd time from Rs. 3/- to Rs. 2/- there is no change in expenditure of outlay made on the good. In this way, if a change (either increase or decrease) in price leads to no change in expenditure or outlay, the good will have unitary elastic demand. (Ed = 1).
  3. When in the price has decreased 3rd time, from Rs. 2 to Re. 1, the expenditure or outlay made on the good has also decreased from Rs. 6000/- to Rs. 4000/-. In this way, if a decrease in price leads to decrease in expenditure or outlay (vice versa), the good will have (relatively) inelastic demand. (Ed < 1).

Question 11.
What are the basic determinants of Elasticity of Demand ?
Answer:
The degree to which quantity demanded responds or reacts to a change in price is known as elasticity of demand. In other words, elasticity of demand is the ratio of proportionate or percentage change in quantity demanded and proportionate or percentage change in price. Determinants of elasticity of demand :

  1. Nature of the commodity : If the good is a necessity, it will have inelastic demand. If the good is a luxury, it will have elastic demand.
  2. Existence of substitutes : If a good is having many or more substitutes, it will have elastic demand. Goods with few substitutes will have inelastic demand.
  3. Number of uses : Goods, which are having many or multiple uses, generally have elastic demand. But goods which have one or two uses will have inelastic demand.
  4. Possibility of postponement: Goods, whose purchases are not postponable, normally have inelastic demand. But goods whose purchases can be postponed have elastic demand.
  5. Time element: Generally, in the short run, goods will have inelastic demand. But the same, products will have elastic demand in the long run.
  6. Complementary of goods : If the goods are complementary that are used simultaneously, they have inelastic demand.
  7. Level of Price : If the price of good is very high (at a higher price level) the demand tends to elastic. Goods, whose price are very low (Eg : Salt, matchbox) have inelastic demand.
  8. Proportion of total expenditure on the good: If a consumer spends a large portion of his income on a single good, that good will have elastic demand. But a good on which a very small percentage of total income is spent will have inelastic demand.

Question 12.
Explain the importance of the concept of Elasticity of Demand.
Answer:
The term elasticity of demand shows the responsiveness or reaction of quantity demanded of a good to a change in the price of that good, or income of the consumer or prices of related goods.

Importance of elasticity of demand : The concept of elasticity of demand has several uses.

  1. To business people in fixing the price of the good: The concept of useful to business people in fixing the price of the good. If the good is having elastic demand, they can change a lower price. If the good possesses inelastic demand, they change a higher price.
  2. To monopolist in price discrimination: A monopolist, following the policy of price discrimination, charges higher price in that sub -market where in good is having inelastic demand. But in the sub – market where the product is having elastic demand, he charges a lower price.
  3. Pricing of joint products: In the case of joint products, it is not possible to know the cost of production separately. A businessman charges a lower price to one of the joint products which is having elastic demand and higher price to that good having inelastic demand.
  4. Nationalisation decisions: The concept is also useful to the government in making decisions relating to nationalisation of private sector organisations. The government nationalises those industries whose goods are having inelastic demand.
  5. International Trade: The concept of elasticity of demand is useful to the government in matters of foreign trade like terms of trade, exchange rates, etc.
  6. To Finance Minister in tax matters: It helps the Finance Minister in determining the tax rates on different goods. The Financial Minister imposes higher taxes on the goods having inelastic demand. He charges or imposes lower rates of taxes on goods which possess elastic demand.
  7. To trade unions in wage bargains : The concept is useful to the trade unions of workers in wage bargains. Workers can demand steep increase in their wages if the product produced by them possesses inelastic demand. But workers have to satisfy with lesser hike in their wages if the goods produced by them possess elastic demand.

Question 13.
Briefly explain the various types of price elasticity of demand.
Answer:
Price elasticity of demand measures how much the quantity demanded of a product changes in response to a change in its price.
The main types are;

  1. Perfectly Elastic Demand (Ed = ∞) : Any small change in price leads to an infinite change in quantity demanded. The demand curve is horizontal.
  2. Elastic Demand (Ed > 1. : A percentage change in price leads to a larger percentage change in quantity demanded consumers are highly responsive to price changes.
  3. Unitary Elastic Demand (Ed = 1) : The percentage change in quantity demanded is exactly equal to the percentage change in price.
  4. Inelastic Demand (Ed < 1) : A percentage change in price leads to a smaller percentage change in quantity demanded. Consumers are less responsive to price changes.
  5. Perfectly Inelastic Demand (Ed = 0) : Quantity demanded does not change at all, regardless of price changes. The demand curve is vertical.

Very Short Answer Questions

Question 1.
Law of Demand.
Answer:
The Law of demand is based on the “Law of diminishing marginal utility”. It explains the inverse relationship between the price and quantity demanded of a commodity. If the price of a good falls, ceteris paribus, the demand for the good increases and vice verrsa. Hence, the Law of Demand is a qualitative concept.

Question 2.
Demand Function.
Answer:
Demand function is Mathematical equation which shows the functional relationship between the demand of a good and the determinants of that good.

Question 3.
Giffen Paradox.
Answer:
Giffen goods are those inferior goods used by poor people, invented by and named after Sir Robert Giffen. This law of demand does not apply in the case of giffen goods. For such goods an increase in price leads to an expansion of their demand.

Question 4.
Veblen Effect.
Answer:
Prestigious goods, are also known as Veblen goods, are those costly goods used by rich people. For such goods the law of demand does not apply. Rich people purchase more of such goods even at increased prices since they are not worried about money expenditure.

Question 5.
Income Effect.
Answer:
When a price of a product decreases, there will be saving in expenditure to the consumers. This saving can be treated just like an increase in the income. In other words, real income of the consumer increases. So, the consumer purchases more quantity of good whose price has decreased.

Question 6.
Substitution Effect.
Answer:
When the price of a good (tea) decreases, the other related product (coffee) becomes relatively costlier. So consumer purchases more quantity of tea and less quantity of coffee, which has become relatively costlier.

Question 7.
Income Demand.
Answer:
Income demand refers to the various quantities of a good which a consumer purchases at different levels of his income. Income demand curve states that there is direct and positive relationship between income and quantity demanded. Income demand curve for normal goods slopes upwards from left to right and for inferior goods, it slopes downwards from left to right.

Question 8.
Demand Curve for Substitutes.
Answer:
Substitutes are goods that satisfy the same want. For example, tea and coffee. If the price of coffee decreases, while the price of tea remains constant. Then the demand of tea decreases, especially if the existing price of tea is higher than the new price of coffee. In such cases consumers shift their demand from tea to coffee. Similarly, if the price of coffee increases, while the price of tea remains constant the demand for tea increases. Hence, in the case of substitutes, the demand curve has a positive slope i.e., it slopes upward from left to right.

Question 9.
Price Demand Curve for complementary goods.
Answer:
Complementary goods are those goods that satisfy the same went jointly. For instance cars and fuel, shoes and socks, bread and butter, lock and key etc. If the price of fuel decreases, the demand for cars increases, with the prices of cars remaining constant. The Cross Demand Curve for complementaries slopes downward.

Theory of Demand Questions and Answers AP Inter 1st Year Economics Chapter 3

Question 10.
Perfectly Elastic Demand.
Answer:
A good is said to be having perfectly elastic (infinite elastic) demand, when its demand increases infinitely due to a slight change (or) no change in price. Perfectly elastic (Infinite elastic) demand curve is horizontal straight line parallel to X – axis and its numerical value is infinite Ed = ∞.

Question 11.
Perfectly Inelastic Demand.
Answer:
If the demand for a good does not change even after significant increase or repeated increases in rise, it is said to be having perfectly inelastic (zero elastic) demand. Perfectly inelastic demand curve is a vertical straight line parallel to Y – axis and its numerical value is zero, Ed = 0.

Question 12.
Price Elasticity of demand.
Answer:
Price elasticity demand shows or indicates the responsiveness or reaction in the quantity demanded to the change in price. It is the ratio of proportionate change in quantity demanded to the proportionate change in price.
\(\mathrm{PEd}=\frac{\text { Proportionate (or) } \% \text { change in Quantity demand }}{\text { Proportionate (or) \% change in Price }}\)

Question 13.
Cross Elasticity of Demand.
Answer:
Cross elastic demand shows or indicates the responsiveness (or) reaction in quantity demanded of a good X (coffee) to a change in the price of related good Y (tea). It is the ratio of proportionate change in quantity demanded of coffee and proportionate change in price of tea.
Proportionate (or) % chane in Quantity demand of X (coffee)
Proportionate (or) % change in Price Y (tea)

Question 14.
Income Elasticity of Demand.
Answer:
The term income elastic demand shows or indicates the responsiveness or reaction in the quantity demanded to a change in income. It is the ratio of proportionate change in quantity demanded and proportionate change in income.
\(\mathrm{IEd}=\frac{\text { Proportionate change in quantity demand }}{\text { Proportionate change in income }}\)

Question 15.
Arc Method.
Answer:
Arc method is a method of calculating the elasticity of demand in which elasticity is calculated in a portion (or) segment of demand curve between two points of the demand curve. In other words, in this method, elasticity is calculated at the mid point of an arc of a demand curve.

One Word Answer Questions

Answer the following questions in ONE WORD.

Question 1.
What type of relationship exists between price and quantity demanded?
Answer:
Inverse (Negative)

Question 2.
What is the combined effect of the income effect and the substitution effect?
Answer:
Price Effect

Question 3.
What formula measure elasticity at any point on a downward sloping linear demand curve?
Answer:
Lower segment ÷ Upper segment

Question 4.
What is the value of elasticity of demand, if the price of a good fall from Rs. 10 to Rs. 8 and the quantity demanded increases from 100 units?
Answer:
– 2.5 (or) 2.5

Theory of Demand Questions and Answers AP Inter 1st Year Economics Chapter 3

Question 5.
Which type of elastic goods are taxed by the finance minister?
Answer:
In elastic (Ed < 1)

Fill in the blanks

Question 1.
The Veblen effect and the substitution effect are ____________ to the Law.
Answer:
exceptions

Question 2.
If coffee and tea are substitution goods, write in the price of coffee will lead to a or an ____________ in the demand for tea.
Answer:
increase (rise)

Question 3.
Where total expenditure decreases with a fall in price and increases with a rise in price, the elasticity of demand is said to be ____________
Answer:
Inelastic

Question 4.
If the price falls, demand increases because of the increase in ____________
Answer:
Real income (or) purchasing power

Question 5.
In the long run the demand for a product will be ____________ because of the availability of substitutes.
Answer:
Elastic

Multiple Choice Questions

Question 1.
Demand for a commodity refers to :
1. Ability to purchase the commodity
2. Willingness to pay the price of the commodity
3. Desire for the commodity
4. Demand is always measured per unit of time.

1. 1 & 2
2. 2 & 3
3. 3 & 1
4. All of the above
Answer:
4. All of the above

Question 2.
The law of demand can be derived with the help of which of the following principles.
1. The Law of Diminishing Marginal Utility
2. The Law of Equi-marginal Utility
3. The Law of Diminishing Returns
4. The Law of Supply
Answer:
2. The Law of Equi-marginal Utility

Theory of Demand Questions and Answers AP Inter 1st Year Economics Chapter 3

Question 3.
A right word shift in the demand curve is the result of:
1. An increase in the price of complementary good
2. A fall in the price of a substitute good
3. An increase in the price of a substitute good
4. A fall in the price of a commodity
Answer:
3. An increase in the price of a substitute good

Question 4.
Price elasticity of demand refers to the :
1. Responsiveness of price to change in demand
2. Responsiveness of demand to a change in price
3. Responsiveness of demand to a change in income
4. Responsiveness of demand to a change in prices of related goods
Answer:
2. Responsiveness of demand to a change in price

Question 5.
As a result of a rise in the price of Onions from Rs. 30 per kg. to Rs. 70 per kg. the quantity demanded decreases from 7 kg. per week to 3 kg. per week. Calculate the price elasticity of demand by using the Arc method.
1. 0.71
2. 1.0
3. 1.71
4. 1.25
Answer:
2. 1.0

Theory of Consumer Behaviour Questions and Answers AP Inter 1st Year Economics Chapter 2

Regular practice with AP Inter 1st Year Economics Study Material Chapter 2 Theory of Consumer Behaviour Questions and Answers helps students stay prepared for examinations.

AP Inter 1st Year Economics 2nd Lesson Theory of Consumer Behaviour Questions and Answers

Essay Questions

Write an essay on the following questions.

Question 1.
Explain the Law of Diminishing Marginal Utility with the help of a diagram.
Answer:
Law of diminishing marginal utility :

It was originally explained by Hermann Heinrich Gossen in 1854. Hence, it is called Gossen’s first law. But Alfred Marshall popularised this law and analysed it in a scientific manner.

Definition :
The additional benefit which a person derives from a given increase of his stock of a thing diminishes with every increase in stock that he already has.

Explain:

Suppose a person starts eating slices of bread one after another. The first slice given him huge satisfaction and his appetite or hunger become less. The second slice yields less satisfaction. The satisfaction from the third slice is reduced further and that from the fourth will be lesser than that of the third. Thus, additional satisfaction will go on decreasing with every successive slice till it drops down to zero. If the consumer is forced to take more, his satisfaction may become negative or the utility changes into dissatisfaction.

UnitsTotal UtilityMarginal Utility
11010
2188
3246
4284
5302
6300
728– 2

The above table shows the change in total utility and marginal utility as the consumer consumes more and more units of a particles good in succession. It can be observed that the slices dimnishes from the business become zero at the 6th unit and then turns negative. The total utility (TU) goes on increasing at deminishing rate until the consumption of 5th unit. Where it becomes maximum and remains the same at the 6th unit, diminishing.

Graffical Illustration:

Theory of Consumer Behaviour Questions and Answers AP Inter 1st Year Economics Chapter 2 1

  1. It is geographically illustrated in the adjacent figure.
  2. The total utility and marginal utility curves have been obtained by plotting the data given in table.
  3. The TU curve is rising till the 6th unit of X is consumed it is to be noted that the TU curve is rising but at a diminishing, rate.
  4. After reaching the saturation point. TU starts to fall, where as the marginal utility curve is continuously falling and becomes zero.
  5. Beyond 6th unit consumed, it is to be noted the marginal utility turns negative.
  6. It means the additional consumption of good x yields disutility in the form of discomfort.
  7. Hence, with an increasing consumption the marginal utility gradually diminishes.

Question 2.
Describe the Law of Equi Marginal Utility with the help of a diagram.
Answer:
Introduction :

The law of equi-marginal utility is an extension of the law of diminishing marginal utility. The law of equi-marginal utility was presented in the 19th century by German economist H. H. Gossen It is also known as Gossen’s second law, law of maximum satisfaction and the law of substitution.

Definition of the law :

“If a person has a thing which can be put to several uses, he will distribute it among these uses in such a way that it has the same marginal utility in all”. – Alfred Marshall.

Explanation of the law : As consumer has unlimited number of wants, he spends his limited income on different goods, and tries to maximise his total satisfaction from the consumption of multiple goods. The consumer can get maximum satisfaction by allocating his income among different commodities in such a way that last rupee spend on each good provides the same marginal utility.

The fundamental condition for consumer’s equilibrium can be explained in the following way.

\(\frac{MUx}{Px}\) = \(\frac{Muy}{Py}\) = MUm

Where, MUx, MUy, = Marginal utility of good X and good Y,
MUm, = Marginal utility of money,
Px, Py = prices of good X and good Y.

Illustration :

This law can be explained with the help of a table and a diagram. Suppose the consumer has a limited money income Rs. 26/- and is prepared to spend on two goods X and Y. The market prices of two goods are Rs. 4 8s Rs. 5 respectively. Further, it is assumed that the marginal utility of money is constant at eight (8) utils. The allocation of money income and equilibrium of the consumer is explained in the following table 2.2.

UnitsMUxMUx/PxUnitsMUYMUY/PY
14411(1)1459(3)
24010(2)2408(6)
3369(4)3357
4328(5)4306
52875255

In the above table, it is clear that the marginal utility of good X and good Y are decreasing due to the operation of the law of diminishing marginal utility. The column no 3 & 6 are calculated by dividing the marginal utilities of both goods at each unit of consumption with their corresponding prices (Rs. 4/- and Rs.5/ – respectively).

From the table, it is clear that being a rational consumer, he buys four units of good X and two units of good Y as the marginal utility of the fourth unit of good X is equal to the second unit of good Y. Thus, his total satisfaction from good X and good Y put together are 55 units which is the maximum. Suppose he spends his last rupee on good X rather from goodY, he get less marginal satisfaction and the total utility will be 54 units, but not 55. So he spends Rs. 16 on good X and Rs. 10 on good Y. Marginal utility of money is equal to the marginal utilities of X and Y (MUX = 32/4; MUY = 40/5, MUM = 8). Therefore, consumer will be in equilibrium at this level of consumption. Hence, this law is called as the law of maximum satisfaction.

Consumer equilibrium may be shown in the below diagram

Theory of Consumer Behaviour Questions and Answers AP Inter 1st Year Economics Chapter 2 2

In the above diagram 2.2, the curves AB and CD are the marginal utility curves of good X and good Y respectively and both curves are slopping downwards.

Suppose the MU of money is constant at Rs. 8/-, \(\frac{\mathrm{MU}}{\mathrm{P}_{\mathrm{x}}}\) is equal to 8 when 4 units of good X is brought and \(\frac{\mathrm{MU}_{\mathrm{Y}}}{\mathrm{P}_{\mathrm{Y}}}\) is equal to Rs. 8/-, when 2 units of good Y is brought.
Thus, at equilibrium, \(\frac{\mathrm{MU}_{\mathrm{x}}}{\mathrm{P}_{\mathrm{x}}}=\frac{\mathrm{MU}_{\mathrm{x}}}{\mathrm{P}_{\mathrm{x}}}\) = MUm

Question 3.
Elucidate the Consumer Equilibrium under indifference curve analysis.
Answer:
Under indifference curve analysis, the equilibrium of the consumer can be explained with the help of an indifference map and price line/budget line.

Conditions of consumer equilibrium : Under indifference technique, a consumer reaches his equilibrium, when the following two conditions are satisfied.

  1. There should be tangency between price line and indifference curve. In other words, the slope of the price line should be equal to the slope of the indifference curve (MRS xy = \(\frac{P_x}{P_y}\))
  2. At the point of tangency where the slopes of indifference curve and price line are equal, the indifference should be convex to the origin.

Explanation of consumer equilibrium :

The following diagram explains consumer equilibrium.

Theory of Consumer Behaviour Questions and Answers AP Inter 1st Year Economics Chapter 2 3

In the above diagram AB is the price line indicating an expenditure of Rs. 50. In the indifference map, there are 3 indifference curves IC1, IC2 and IC3.

At points P and Q, Indifference curve is intersecting the price line. At these points of intersection, the consumer gets lesser satisfaction with an expenditure of Rs. 50. But at point E, which is the point of tangency between price line and indifference curve 2, the consumer gets higher satisfaction / utility with the same expenditure of Rs. 50. So, P and Q the points of intersection between price line and indifference curve are not the points of consumer equilibrium. Only E, the point of tangency between price line and indifference curve 2, is the point of consumer equilibrium.

At the point E, (the point of tangency) IC2 is also convex to the origin. So, the consumer, by spending Rs. 50, and purchasing OM of X and ON of Y, is getting maximum possible satisfaction indicated by indifference curve 2.

Theory of Consumer Behaviour Questions and Answers AP Inter 1st Year Economics Chapter 2

Question 4.
Briefly discuss about the assumptions of Indifference curve analysis.
Answer:
Assumptions of Indifference curve analysis :
a) Rationality: The consumer is rational and possesses full information about all the relevant, aspects of economic environment in which he lives so as to get maximum satisfaction.

b) Scale of Preferences: All wants of a consumer are not of equal urgency or importance. Since his resources are limited and he cannot fulfill all his wants, he must pick and choose more important and more urgent wants for satisfaction. Thus, some wants take precedence over others. That is, a consumer ranks his wants and builds up a scale of preference.

c) Ordinal Utility: Unlike the cardinal utility approach, ordinal utility approach assumes the utility is only ordinally measurable. That is, a consumer is able to compare the satisfaction in ordinal terms i.e. 1st, 2nd, 3rd and so on.

d) Consistency or Transitivity of Choice : Consumer’s choices are assumed to be consistent. It means that if a consumer prefers A to B and B to C, he must prefer A to C.

e) Monotonic Preferences : Monotonic preference means that the consumer always prefers to have more of a commodity, as more quantity gives more satisfaction. In indifference curve analysis, it means that the consumer prefers a combination that has atleast more of one good, when compared to another combination. E.g., Suppose there are combinations A (2X + 3Y) and B (4X + 3Y), the consumer prefers combination B which has more of good X.

f) Substitution : To be on the same level of satisfaction, if the quantity of one good is substituted with another good in a bundle of two goods. He substitutes the good that gives less satisfaction, for a good that gives more satisfaction. Rate of substitution is that rate at which the quantity of one good is forgone for the gain of one unit of the other.

Short Answer Questions

Question 1.
Explain the properties of indifference curves.
Answer:
Indifference curves are a fundamental concept in microeconomics, particularly in consumer theory. There are some key properties.

i. Downward slopping :
Indifference curves slope downward from left to right indicating that as the quantity of one good increases, the quantity of the other good must decrease to maintain in the same level.

Theory of Consumer Behaviour Questions and Answers AP Inter 1st Year Economics Chapter 2 4

ii. Convex to origin :
Indifference curves convex to the origin, meaning that they bow inward toward the origin. This reflects the diminishing marginal rate of substitution between the two goods.

Theory of Consumer Behaviour Questions and Answers AP Inter 1st Year Economics Chapter 2 5

iii. Non-intersecting :
Indifference curves do not intersect each other. If they did, it would imply that the same bundle of goods provide two different levels of satisfaction which is not possible.

Theory of Consumer Behaviour Questions and Answers AP Inter 1st Year Economics Chapter 2 6

iv. Higher curves represent higher satisfaction :
Indifference curves that are farther from the origin represent higher levels of satisfaction. This is because they represent more goods or services being consumed.

v. Continuous and Smooth :
Indifference curves are typically assumed to be continuous and smooth reflecting the idea that consumers can make marginal adjustments to their consumption bundles.

Question 2.
What are the assumptions of Marginal Utility Analysis ?
Answer:
Definition of Law : The additional benefit which a person derives from a given increase of his stock of a thing diminishes with every increase in stock that he already has. – Alfred Marshall.

Meaning : Law that explain the relationship between quantity consumed and utility derived from each successive unit consumed is called the law of diminishing marginal utility. The law says that as a consumer consumes more and more units of a good the extra satisfaction that he derives from extra unit of a good goes on falling.

Assumptions :

  • Rationality : This law assumed that the consumer is a rational being in the sense that he seeks to maximize satisfaction.
  • Cardinal measurement of utility : Utility is a quantifiable entity and is measurable.
  • Hypothesis of Independent utility : It implies that the utility of any commodity depends on its own quantity.
  • Constant marginal utility of money : The marginal utility of money remains constant throughout when the individual is spending money on a good.
  • Homogeneous : All units of a good are homogeneous in the sense they are alike both quantitatively and qualitatively.
  • No time gap : This law assumed that there is no time lag between the consumption of one unit and another.
  • Constancy : It implies the income, tastes, and preferences of the consumer remain constant.

Question 3.
Define Budget line. Explain with the help of a diagram.
Answer:
A budget line, also known as price line, shows different combinations (quantities) of two goods (X and Y or mangoes and oranges) that can be purchased by the consumer, with a given income (Rs. 50) and with the prices X (Mangoes) Rs. 10 and with the price of Y (oranges) Rs. 5. It is also known as ISO expenditure line. Any point on the same price line/budget line results in the same or equal expenditure to the consumer. It can be drawn by connecting or joining maximum quantities of X and Y.

Price line Diagram

Theory of Consumer Behaviour Questions and Answers AP Inter 1st Year Economics Chapter 2 7

Question 4.
Draw a diagram showing shifts in budget line due to change in the price of Good Y.
Answer:
Shifts in budget line or price line take place with a change in the income of the consumer, with the price of X (mangoes) and Y (oranges) remaining constant.

Theory of Consumer Behaviour Questions and Answers AP Inter 1st Year Economics Chapter 2 8

In the above diagram, PL is the original Price line/Budget line, showing an expenditure Rs. 150 and income of Rs. 150. When his income has increased to Rs. 200/- he would be able to spend to Rs. 200, and new price line has shifted to the right of the original, and it is P1L1. When there is a decrease in his income, he would be able to spend only Rs.100. The new price line has shifted to the left of the original one, and it is P2L2.

Question 5.
Write the limitations of the Law of Diminishing Marginal Utility.
Answer:
The following cases are some of the exceptions to the law of diminishing marginal utility.

  1. This law does not apply to money.
  2. Hobbies such as collection of stamps, old paintings, coins etc., are exceptions to the law of diminishing marginal utility.
  3. It is pointed out that the consumption of liquor is not subject to the law of diminishing marginal utility. The more a person drinks liquor, the more he likes it.
  4. Further, the law does not hold good if any change in income of the consumer, tastes and preferences occurs in the middle.

Question 6.
Briefly write about the Assumptions of Law of Equi-Marginal Utility.
Answer:
The following are the assumptions of law of equi-marginal utility.

  1. Utility is cardinally measurable.
  2. The marginal utility of money is constant.
  3. Consumer is rational.
  4. Income of the consumer is given and constant.
  5. Prices of the commodities are given and constant.
  6. The law of diminishing marginal utility operates.

Question 7.
What are the short comings of Marshall in utility analysis ?
Answer:
The following are the main defects pointed out in the Marshallian approach.

  1. Cardinal measurability of utility is not possible.
  2. Assumption of independent utilities is unrealistic.
  3. Assumption of constant marginal utility of money is unrealistic.
  4. This is a one-commodity model.
  5. Income effect, price effect and substitution effect are not clearly broughtout.

Question 8.
Write about Indifference Map.
Answer:
The consumer’s preferences over all the combinations can be represented by a family of indifference curves as shown in Figure. This is called an indifference map of the consumer. All points on each indifference curve represent combinations which give equal level of satisfaction to the consumer.

Theory of Consumer Behaviour Questions and Answers AP Inter 1st Year Economics Chapter 2 9

Monotonicity of preferences implies that between any two indifference curves, the consumer prefers the one which gives him more satisfaction. Obviously, it contains more of either or both the goods. In fig. the IC curves are numbered and arranged in ascending order from left to right. As we move from the lower number to the higher number or from left to right, the level of satisfaction increases.

Theory of Consumer Behaviour Questions and Answers AP Inter 1st Year Economics Chapter 2

Question 9.
What are the assumptions of consumer equilibrium ?
Answer:
Assumptions :

  1. Consumer has an indifference map showing his scale of preferences which remains the same throughout the analysis.
  2. Money income is given and remains constant.
  3. Prices of the two goods are given and will remain constant.
  4. The consumer is rational and tries to maximize his satisfaction.
  5. There is no change in tastes and habits of the consumer.

Question 10.
Write a short note superiority of the I.C. Technique.
Answer:
The indifference curve analysis is superior to utility analysis

  1. as it dispenses with the assumption of measurability of utility,
  2. it studies consumption of more than one commodity at a time which is realistic in life,
  3. it does not assume constancy of money, and
  4. it segregates income effect from the substitution effect.

Very Short Answer Questions

Question 1.
Difference between Cardinal Utility and Ordinal Utility.
Answer:

Cardinal UtilityOrdinal Utility
1. It can be quantified or expressed or measured in numerical terms numbers.1. It cannot be expressed or measured or in number or numerical terms.
2. Consumer can say clearly how much more or how much less utility he gets from different goods.2. Consumer cannot say how much or how much less he gets from different goods.

Question 2.
Relation between Total Utility and Marginal Utility.
Answer:

  1. As long as Marginal Utility is positive, total utility increases but at a decreasing rate.
  2. When Marginal Utility becomes zero, total utility reaches its maximum- this is called the point of saturation.
  3. If marginal utility turns negative (from further consumption), total utility starts to decrease.

Question 3.
Marginal Utility.
Answer:
It can be defined as the additional utility derived from an additional unit consumed. It is also defined as the addition to the total utility derived from the consumption of one additional unit. In short, Marginal Utility is the change in the total utility, resulting from the consumption of one additional unit.

Question 4.
Law of Equi-Marginal Utility.
Answer:
It is an extension of the law of diminishing marginal utility. It was presented in the 19th century by German .economist H.H. Gossen. According to Alfred Marshall, If a person has a thing which can be put to several uses, he will distribute it among these uses in such a way that it has the same marginal utility in all.

Question 5.
Find the Marginal Utility from the given table.

Units of XTotal UtilityMarginal utility
140
270
390
4100
5100
690

Answer:

Units of XTotal UtilityMarginal utility
14040
27030
39020
410010
51000
69010

Question 6.
Indifference curves.
Answer:
An indifference curve can be defined as “the locus of points each representing a different combination of two goods yielding the same utility or level of satisfaction”. Therefore, a consumer is indifferent between any two combinations of goods when it comes to making a choice between them. It is also called “iso-utility curve” and “equal utility curve”.

Question 7.
Condition of transitivity.
Answer:
Transitivity is important because it ensures rational decision-making by consumers. If preference are not transitive, it can lead to cycles and inconsistencies, making it difficult for consumers to make clear choice. Overall, transitivity helps in creating predictable patterns in consumer behaviour, which is crucial for economists and marketers in understanding and analyzing purchasing decisions.

Question 8.
Marginal Rate of Substitution (MRS).
Answer:
Marginal Rate of Substitution is such substitution of one good for another (two different goods) which results in or gives the same level of satisfaction to the consumer before substitution and after substitution.

Question 9.
Price Line / Budget Line.
Answer:
A price line, also known as budget line, shows the different (quantities) combinations of two goods (namely X and Y or mangoes and oranges) that can be purchased by the consumer with a given income (Rs.50/) and with given prices of X (Rs.10) and Y (Rs.5). Price line is aso known as budget line or Iso expenditure line. Any point on the same price line / budget line results in the same or equal amount of expenditure to the consumer.

Theory of Consumer Behaviour Questions and Answers AP Inter 1st Year Economics Chapter 2

Question 10.
Consumer Equilibrium.
Answer:
A consumer is said to be in equilibrium when he obtains the maximum satisfaction. Under this analysis, with the given scale of preference and budget line.

One Word Answer Questions

Answer the following questions in ONE WORD.

Question 1.
When total utility is maximum, then marginal utility ?
Answer:
Zero

Question 2.
The sum of marginal utilities equal to :
Answer:
Total Utility.

Question 3.
The equation of consumer equilibrium under the law of equi marginal utility is :
Answer:

\(\frac{\mathrm{MUx}}{\mathrm{Px}}=\frac{\mathrm{MUy}}{\mathrm{Py}}=\mathrm{MU}_{\mathrm{m}}\)

Question 4.
Consumer’s choice are assumed to the transitive that, if a consumer prefers A to B and B to C he must prefer :
Answer:
A to C.

Question 5.
From the budget equation if Px = 5, Qx = 2, Py = 3, Qy = 5. Then calculate the money income (M) of the consumer.
Answer:
Px . Qx + Py . Qy = M
So, 5 × 2 + 3 × 5 = 10 + 15 = 25 Rs.

Fill in the blanks

Question 1.
In __________ utility analysis, utility can be measured in definite numbers such as 1, 2, 3, 4, etc.
Answer:
Cardinal

Question 2.
The Law of Diminishing Marginal Utility states that when more and more units of commodity is consumed, the marginal utility __________.
Answer:
Decreases

Question 3.
Indifference curves are always __________ to the origin.
Answer:
Convex

Question 4.
The slope of indifference curve is measured by __________
Answer:
MRS (The Marginal Rate of Substitution)

Theory of Consumer Behaviour Questions and Answers AP Inter 1st Year Economics Chapter 2

Question 5.
A set of indifference curves drawn in a graph is called __________
Answer:
Indifference Map

Multiple Choice Questions

Question 1.
Which of the following is true about the relationship between TU and MU?
1. The TU is maximum, when the MU is negative
2. The TU decreases, when the MU is negative
3. The TU increases at a decreasing rate, when the MU is negative
4. The TU is constant, when the MU is negative
Answer:
2. The TU decreases, when the MU is negative

Question 2.
The total utility that Rahul derives after consuming 4 oranges is 20, whereas, the total utility on consuming 5 oranges is 19. What is the marginal utility for 5th orange?
1. 1
2. 0
3. – 1
4. ± 1
Answer:
3. – 1

Question 3.
The marginal utilities of good X and good Y are 300 and 450 utils, at equilibrium respectively. If the price of the good Y is Rs. 60, what is the price of good X at equilibrium ?
1. Rs. 55
2. Rs. 75
3. Rs. 40
4. Rs. 60
Answer:
3. Rs. 40

Question 4.
The convex shape of indifference curve is due to :
1. Increasing MRS
2. Decreasing MRS
3. Constant MRS
4. Positive MRS
Answer:
2. Decreasing MRS

Question 5.
A parallel rightward shift in budget line is due to :
1. Increase in price of good X
2. Increase in price of good Y
3. Increase in income of the consumer
4. Scale of Preference
Answer:
3. Increase in income of the consumer

Introduction to Economics Questions and Answers AP Inter 1st Year Economics Chapter 1

Regular practice with AP Inter 1st Year Economics Study Material Chapter 1 Introduction to Economics Questions and Answers helps students stay prepared for examinations.

AP Inter 1st Year Economics 1st Lesson Introduction to Economics Questions and Answers

Essay Questions

Write an essay on the following questions.

Question 1.
Draw and explain production possibility Frontier.
Answer:
The Production Possibility Frontier (PPF) is a curve on a graph that illustrates the possible quantities that can be produced of two products if both depend upon the same finite resource for their manufacture. The PPF is also referred to as the production possibility curve.

It also plays a crucial role in economics. For example, it can demonstrate that a nations economy has reacted the highest level of efficiency possible.

Example : Consider an economy which can produce com or cotton by using its resources. Table gives some of the combinations of corn and cotton that the economy can produce, when its resources are fully utilised.

Table : Production Possibiilities
PossibilitiesCornCotton
A010
B19
C27
D34
E40

If all the resources are used in the production of corn, the maximum amount of com that can be produced is 4 units and if all resources are used in the production of cotton, at the most, 10 units of cotton can be produced. The economy can also produce 1 unit of corn and 9 units of cotton or 2 units of corn and 7 units of cotton or 3 units of com and 4 units of cotton and so on as shown in the table. There can be many other possibilities.

The figure illustrates the production possibilities of the economy. Any point on or below the curve represents’a combination of corn and cotton that can be produced with the economy’s resources. The curve gives the maximum amount of corn that can be produced in the economy for any given amount of cotton and vice-versa. This curve is called the “Production Possibility Frontier”.

The production possibility frontier gives the combinations of corn and cotton that can be produced when the resources of the economy are fully utilized. Note that a point (Point F) lying strictly below the production possibility frontier represents a combination of com and cotton that will be produced when all or some of the resources are either underemployed or are utilized in a wasteful fashion.

Introduction to Economics Questions and Answers AP Inter 1st Year Economics Chapter 1 1

If more of the scarce resources are used in the production of com, less resources are available for the production of cotton and vice versa. Therefore, if we want to have more of one of the goods, we will have less of the other good. Thus, there is always a cost of having a little more of one good in terms of the amount of the other good that has to be forgone.

This is know as the opportunity cost of an additional unit of the goods.

Every economy has to choose one of the many possibilities that it has. In other words, one of the central problems of the economy is to choose from one of the many production possibilities.

Question 2.
Distinguish between Centrally Planned Economy and Market Economy.
Answer:
In a Centrally Planned Economy, the Government or the central authority plans all the important activities in the economy while as in a market economy, all economic activities are organized through the market. Here is the differences between them :

FeaturesCentrally Planned EconomyMarket Economy
Decision MakingCentral authority, typically the government, makes all key economic decisions regarding what to produce, how to produce it, and for whom to produce it.Economic decisions are primarily made by individuals and private firms based on their self interest and in response to market signals like prices.
Resource AllocationThe Government owns most of the resources (Land, labour, capital) and directs their allocation according to a national economic plan.These are largely privately owned. Their allocation is driven by the interaction of supply and demand in free markets.
PricingPrices are generally set by the Government rather than by the forces of supply and demand.Prices of goods and services are determined by the forces of supply and demand.
ProductionProduction targets and methods are determined by the central plan state owned enterprises are common.Private firms decide what and how much to produce in response to consumer demand and the pursuit of profit.
CompetitionIt is typically limited or non-existent as the state controls production.It among businesses is key characteristic, leading to innovation efficiency and variety.
Consumer SoverignityConsumer choice is often limited to what the government decides to produce.Consumers have significant influence over what is produced through their purchasing decisions.
IncentivesThese are often based on meeting production targets rather than profit.Profit act as a primary incentive for businesses and individuals. US, Japan.
ExamplesSoviet Union, North Korea and Cuba.

Question 3.
Give the meaning, importance and scope of economics.
Answer:
Meaning :

Microeconomics : The term Microeconomics is derived from the Greek word MIKROS, which means small. Thus, Microeconomics is the theory of small scale economics. Microeconomics is that branch of Economics, which deals with the analysis of individual economic units like a firm, a farmer, a good etc. It studies the economic actions and behaviour of individual units like firms and small groups of individual units like industry. Microeconomics does not study the economy in its totality. So, the microeconomics is known as partial analysis.

According to K.E. Boulding Microeconomics is the study ofparticular firms, particular households, individual prices, wages, incomes, individual industries and particular commodities.

Importance of Microeconomics :

  • Microeconomics explains how a free market economy with its millions of consumers and producers words to decide about the allocation of productive resources among the thousands of goods and services.
  • This analysis is useful to the Government to frame suitable policies to promote economic efficiency for the efficient use of scarce resources to achieve economic growth and stability.
  • Microeconomics can be used to examine the condition of economic welfare and it suggests ways and means to bring about maximum social welfare.
  • This analysis is also applicable to the field of international trade in the determination of exchange rates.

Scope of economics :
The scope of microeconomics is vast and in compasses various areas of study.

  1. Individual Units Analysis : It studies the behaviour and decisions of individual consumers, firms, and industries, focusing on how they interact in specific markets.
  2. Product Pricing : Examines how the price of a particular good or service is determined by study and demand in individual markets.
  3. Factor Pricing : Analyses how the prices of inputs (land, labour, capital and organisation) are set, resulting in rent, wages, interest and profit.
  4. Consumer and Producer Behaviour : Investigates how consumers allocate their income and how producers decide on output and input combinations.
  5. Market structures : Studies different market forms like perfect competition, monopoly, monopolistic competition, and oligopoly, and how they affect pricing and output.
  6. Economic Welfare : Looks at efficiency in production and consumption, addressing questions like what to produce, how to produce and for whom to produce aiming to maximize social welfare.
  7. Resource Allocation : Explores how limited resources are distributed among competing uses to achieve efficient outcomes.
  8. Policy Applications : Helps in formulation of economic policies, taxation and understanding international trade and tariffs.

Introduction to Economics Questions and Answers AP Inter 1st Year Economics Chapter 1 2

Introduction to Economics Questions and Answers AP Inter 1st Year Economics Chapter 1

Question 4.
Define Macro economics explain its importance and scope.
Answer:
Macroeconomics: The term Macroeconomics is derived from the Greek word MAKROS which means large. Thus, Macroeconomics is the theoiy of large-scale economics. The modern developments in Macroeconomics are most closely associated with the work of J.M. Keynes. Macroeconomics is known as Income and Employment Theory. Macroeconomics is also called as aggregative economics. It studies aggregates like national income, total consumption, total savings and total employment etc.

According to K.E. Boulding Macroeconomics studies national income, not individual income, general price level instead of individual prices and national output instead of individual output.

Importance of Macroeconomics : Macroeconomic analysis has acquired great importance after Great Depression (1929-39). The study of macroeconomics is useful for various reasons as explained below.

  • The study of macroeconomics helps to understand the problems of unemployment, inflation etc., and suggests how to solve them.
  • It helps to evaluate the overall functioning of an economy in order to distribute national income among different sections of the society.
  • Macroeconomics provides solutions to overcome the problems of business cycles and helps to understand their occurrence.
  • Macroeconomics includes economic growth and suggests how developing countries can use their resources to maximise their growth.

Scope of Microeconomics:

Introduction to Economics Questions and Answers AP Inter 1st Year Economics Chapter 1 3

  1. National Income and GDP : It studies the measurement, components, and growth of national income and Gross Domestic Product, helping to assess a country’s economic performance.
  2. Employment and unemployment: It examines the overall level of employment, unemployment trends, and the factors influencing job creation and joblessness,
  3. General Price Level and Inflation : The analysis of inflation, deflation and price stability is central, including their causes, effects and policy responses.
  4. Economic Growth and Development : Macroeconomics investigates long¬term economic growth, factors driving development and policies for raising living standards.
  5. Monetary and Fiscal Policy : It covers how governments and central banks use tools like taxation, government spending, and interest rates to influence economic activity and maintain stability.
  6. Business Cycles : The study of economic fluctuations – booms and recessions and their impact on the economy.
  7. International Trade and Finance : It explores trade between countries exchange rates, and the effects of globalization on domestic economies.

Short Answer Questions

Write the answers briefly for the following questions.

Question 1.
Discuss the central problem of an economy.
Answer:
Scarcity is the central problem of any economy. This fundamental issue arises from the fact that human wants and desires are virtually unlimited, while the resources available to satisfy them are finite. This mismatch between unlimited wants and limited resources forces every economy to make crucial decisions about how to allocate these scarce resources.

The central problem of an economy can be broken down in three fundamental questions :

  1. What to produce ?
  2. How to produce?
  3. For whom to produce ?

1. What to produce ? Given limited resources, an economy cannot produce everything that everyone wants. Therefore, it must decide which goods and services should be produced and in what quantities.

2. How to produce ? Once the decision on what to produce is made, the economy must determine the most efficient way to produce these goods and services.

3. For whom to produce ? After goods and services are produced, the economy must decide how they will be distributed among its members.

These three questions highlight core challenge of scarcity and the necessity for economic systems to make choices regarding the allocation of limited resources to satisfy competing wants.

Question 2.
Mention any four differences between Microeconomics and Macroeconomics.
Answer:
Both Micro and Macroeconomics are interdependent, neither of the two is complete without the other. In spite of close relationship between the two branches of economics, fundamentally they differ from each other. The following table explains the differences.

MicroeconomicsMacroeconomics
1. The word MICRO derived from the Greek word MIKROS, which means “small”.1. The word MACRO derived from the Greek word “MAKROS, which means “large”.
2. Microeconomics is the study of individual units and groups of individual units of the economy.2. Macroeconomics is the study of economy as a whole.
3. It is known as Price Theory3. It is known as Income and Employment Theory.
4. Microeconomics explains price determination in both commodity and factor markets.4. Macroeconomics deals with national income, total employment, aggregate savings & investment, general price level and economic growth etc.
5. Microeconomics is based on price mechanism which depends on demand and supply.5. Macroeconomics is based on aggregate demand and aggregate supply.

Question 3.
Explain the differences between free goods and economic goods.
Answer:
Differences between Free Goods and Economic Goods.

Free GoodsEconomic Goods
1. Free goods are gifts of nature.1. Economic goods are man-made.
2. These goods have no cost of production.2. These goods have cost of production.
3. These goods do not have a price.3. These goods do have price.
4. These goods have value in use, but no value in exchange.4. These goods have both value in use and value in exchange.
5. These values are not included in National Income.5. These values are included in National Income.

Question 4.
Explain any four characteristics of wants.
Answer:
Human wants are the basis for all economic activities. They depend on economic and social status of individuals. The nature of human wants can be understood by considering the following characteristics.

  1. Unlimited wants: Human wants are unlimited. If you satisfy one want another one crops up.
  2. A particular want is satiable: A single want can be fully satisfied as wants are unlimited, a person can satisfy all wants. For example, if a person is thirsty he can satisfy it by drinking a glass of water.
  3. Competition: Wants are unlimited, whereas resources to satisfy them are limited. Thus certain wants compete with each other. Eg., A consumer can buy either milk or vegetables with the money he has. Though he wants both, he has to choose one, depending on the intensity of the want.
  4. Complementary: Satisfaction of a single want may require the use of more number of commodities. For example, writing need is satisfied only when we have pen, ink and paper together.
  5. Substitution: A person can satisfy his want with different commodities. For example, if a person is hungry he can eat either a meal or fruits to satisfy his hunger. He can substitute one for the other.
  6. Recurring or Repetitive: Certain wants recur. When you satisfy a particular want at a point of time it recurs or reappears at another time, e.g., hunger, thirst, desire to play etc.
  7. Habits: Wants change into habits. For example; smoking cigarettes as a joke forms into a habit if it is not controlled.
  8. Wants vary with time, place and person: Wants are dynamic in nature. Hence, they are changing from time to time, place to place and person to person. E.g.: Dosa for breakfast and rice for lunch.

Question 5.
Explain four kinds of utility with examples.
Answer:
The concept of utility has great importance in economics. The want satisfying capacity of a commodity at a given point of time is known as utility. It is a subjective concept and resides in human mind. Others do not know it unless one expresses it in words or body language.

Types of Utility :
Utility is divided into four types. They are :

  1. Form Utility : If a commodity satisfies a consumer by changing its shape, colour, size etc., is known as form utility. For example, A log has utility in the form of a chair or a table.
  2. Place Utility : When goods’acquire utility with the change of their place, is known as place utility. For example, vegetables at the production place have no utility but when they are brought to the market they gain utility.
  3. Time Utility : Goods acquire additional utility because of time. For example, woollen clothes have utility in winter but not in summer.
  4. Service Utility : Services also have the ability to satisfy human wants. For example, the teaching of a teacher directly helps a student to build his career. This is also known as personal utility.

Question 6.
Classify of Human Wants.
Answer:
Wants are classified mainly into 3 categories like necessities, comforts, and luxuries.

1. Necessities :
Necessities are those which are essential for living. Necessities refer to the want of products or services essential for survival.
E.g., food, clothing and housing.

2. Comforts :
Comforts refer to those products or services that help in making life comfortable. Comforts are less urgent than necessities. Comforts lie between necessities and luxuries. A person can live without these comforts but they help make life easier for them.
Eg.: Fan, cot, bicycle etc.

3. Luxuries :
Luxuries are those wants which give more pleasure and prestige. They are superfluous and expensive. They make humans feel better about themselves. They don’t actually need but are mostly meant for showing off.
Eg. Jewellery, expensive cars, elegant furniture, etc.

Question 7.
Explain Deductive and Inductive Method.
Answer:
Deductive Method :
Deductive method is mainly used by the classical economists. This method is also known as abstract, hypothetical and a priori method because it is based on abstract reasoning and not on actual facts. This method of reasoning tries to deduce conclusions from certain fundamental assumptions or accepted axioms or truths established and handed over from generation to generation. This method proceeds from the general to the particular.
Eg. The Law of Diminishing Marginal Utility, The Law of Demand.

The following are the steps under Deductive Method.

  1. Selecting the problem
  2. Formulating assumptions
  3. Formulating the hypothesis
  4. Verifying the hypothesis.

Inductive Method :
Inductive method is also known as historical, empirical, concrete, ethical or realistic method. The German school of economists advocated this method. This method proceeds from particular to the general, i.e., it refers to a process where facts are collected, arranged, analyzed and then general conclusions derived.
Eg: The law of Diminishing Returns, Malthusian theory of population. These are four steps‘involved in deriving economic generalizations through this method.

They are :

  1. Selection of the problem
  2. Collection and compilation of data.
  3. Analysis and common observations
  4. Generalization

Question 8.
Write about the important features of growth definition.
Answer:
Important features of Growth Definition : This definition analyses the benefits of improving patterns of resource allocation. Some of the important features of Samuelsons definition are :

  • Prof. Samuelson’s definition is dynamic in nature as it considers both the present and future consumption, production and distribution.
  • Growth definition deals the problem of choice in a dynamic society. Hence, his definition broadened the scope of economics.
  • Samuelson’s definition is superior to that of Robbins definition, because he shifted the emphasis, from the scarcity of resources to income, output and employment and later to the problems of economic growth.

Introduction to Economics Questions and Answers AP Inter 1st Year Economics Chapter 1

Question 9.
What are the features of Welfare Definition ?
Answer:
Important features of Welfare Definition :

  • Marshall used the term Economics for Political Economy to make it similar to Physics. He assumed that economics must be a science even though it deals with the ever-changing forces of human nature.
  • Economics studies only economic aspects of human life and it has no concern with the political, social and religious aspects of life.
  • Marshall’s definition considered those human activities which increased welfare.
  • This definition has given importance to man and his welfare and recognised wealth as a means for the promotion of human welfare.

Very Short Answer Questions

Question 1.
Jacob Viners definition.
Answer:
According to Jacob Viner, “Economics is what economists do”. It implies that the best way of understanding the scope and subject matter of economics is to study the problems and solutions offered by economists, and his definition is considered as the modern definition.

Question 2.
Cause of Choice Problem.
Answer:
The cause of choice problem refers to the underlying reasons and factors that make the act of choosing difficult, stressful or lead to suboptimal outcomes. It explores why, despite having options, individuals often struggle with making decisions.

Question 3.
Production Possibility Curve (PPC).
Answer:
Production Possibility Curve (PPC), also known as Production Possibility Frontier (PPF). It is a graphical representation that illustrates the maximum possible combinations of two goods or services an economy can produce efficiently using all its available resources and given the current technology.

Question 4.
Value – Price.
Answer:
Value : The value of any good or service is the power to command another article or service in change.
These are of two types :

  1. Value in use,
  2. Value in exchange.

Value in use refers to the capacity of the good to satisfy human wants whereas value in exchange refers to the quantity of goods can be exchanged for another.

Question 5.
Consumer Goods.
Answer:
A consumer good is a finished good bought by individual or households for final consumption.
Eg : Fruits, milk, pens etc.

Again these are of two types :

i) Perishable goods :
Generally, they perish with a single use.
Eg: Milk, Fruits.

ii) Durable goods :
These are used over time rather than being completely used up at the moment of consumption.
Eg : TV and Computer.

Question 6.
Producer or Capital Goods.
Answer:
Goods which are used in the production of other goods are called producer or capital goods. They satisfy human wants indirectly.
Eg : Machines, buildings etc.

These are divided into two types.

  1. Single-use Capital Goods : These goods are used only once in the production process.
    Eg : Raw materials, coal and chemicals
  2. Durable use Capital Goods : These goods are used for long time in the process of production.
    Eg: Machines, Tools etc.

Question 7.
Intermediary Goods.
Answer:
Goods which are under the process of production and semi-finished goods are known as intermediary goods. The goods which are not yet finished and under different stages of production are known as intermediary goods.
Eg.: Cement, bricks and steel used as intermediary goods in construction work.

Question 8.
Wealth – Income.
Answer:

  • Wealth : It means stock of assets held by an individual or institution that has the potential for yielding income in some form. It may be held in various forms. These include money shares of companies, land, ornaments etc.
  • Income : It refers to the money earned or received from various sources, such as various economic activities. It is a flow from wealth. In every economy it flows from households to firms and vice-versa.

Question 9.
Deductive Method.
Answer:
Deductive method is mainly used by the classical economists. This method is also known as abstract, hypothetical and a priorimethod because it is based on abstract reasoning and not on actual facts. This method of reasoning tries to deduce conclusions from certain fundamental assumptions or accepted axioms or truths established and handed over from generation to generation. This method proceeds from the general to the particular.
Eg : The Law of Diminishing Marginal Utility, The Law of Demand.

Introduction to Economics Questions and Answers AP Inter 1st Year Economics Chapter 1

Question 10.
Positive Economics.
Answer:
A positive science may be defined as a body of systematized knowledge concerning What is. The classical school of economists were of the opinion that economics is purely a positive science which had to right to comment upon the rightness or wrongness of economic behaviour. Further, economist cannot give any final judgement on any matter.

One Word Answer Questions

Answer the following questions in ONE WORD.

Question 1.
The Greek term OIKONOMIA means.
Answer:
The Greek term OIKONOMIA means Household Management.

Question 2.
Who is known as the father of Economics?
Answer:
Adam Smith is known as the father of Economics.

Question 3.
Which branch of economic studies economic problems relations to individual economic units.
Answer:
Microeconomic studies economic problems relating to individual economic units.

Question 4.
The General Theory of Employment, Interest and Money was written by :
Answer:
J.M Keynes.

Question 5.
The problem of allocating scarce resources so as to achieve the greatest possible satisfaction of wants is known as ……………….
Answer:
Economic Problem.

Fill in the blanks

Question 1.
The book Wealth of Nations was written by __________
Answer:
Adam Smith

Question 2.
Macroeconomics was popularized by __________
Answer:
J.M. Keynes

Question 3.
__________ Economics deals with general price level instead of relative prices.
Answer:
Macroeconomics

Introduction to Economics Questions and Answers AP Inter 1st Year Economics Chapter 1

Question 4.
Scarcity definition of economics was given by __________
Answer:
Lionel Robbins

Question 5.
Inductive Method is also known as __________
Answer:
Historical (Or) Empirical (Or) Realistic Method

Multiple Choice Questions

Question 1.
Which of the following is not one of the central questions that the study of economics is supposed to answer?
1. Who produces what ?
2. Who consumes what ?
3. When are goods produced ?
4. How are goods produced ?
Answer:
3. When are goods produced ?

Question 2.
Under ‘Deductive Method’ the logic proceeds from :
1. Particular to General
2. General to Particular
3. Particular to Particular
4. General to General
Answer:
2. General to Particular

Question 3.
Which of the following may he defined as a systematic body of knowledge concerning ‘What is’?
1. Micro Economics
2. Public Economics
3. Normative Economics
4. Positive Economics
Answer:
4. Positive Economics

Question 4.
What do you mean by a mixed economy?
1. Coexistence of the modern and traditional industries
2. Coexistence of the public and private sectors
3. Coexistence of foreign and domestic sectors
4. Coexistence of commercial and subsistence farming.
Answer:
2. Coexistence of the public and private sectors

Question 5.
What does the bowed-out (Concave) shape of the production possibility curve illustrate ?
1. Increasing opportunity cost
2. Constant opportunity cost
3. Decreasing opportunity cost
4. Under utilization of resources
Answer:
1. Increasing opportunity cost

Chemical Coordination and Integration Questions and Answers AP Inter 1st Year Zoology Chapter 9

Regular practice with AP Inter 1st Year Zoology Study Material Chapter 9 Chemical Coordination and Integration Questions and Answers helps students stay prepared for examinations.

AP Inter 1st Year Zoology 9th Lesson Chemical Coordination and Integration Questions and Answers

IV. Very Short Answer Questions

Question 1.
Define the following.
A) Endocrine gland
B) Hormone
Answer:
A) Endocrine gland: These are ductless glands liberate their secretions into the bloodstream, transported to target organs located at a distance.

B) Hormone: Hormones are non-nutritive chemicals which act as intercellular messengers and are produced in trace amounts.

Question 2.
Which hormonal deficiency is responsible for the following?
A) Cretinism
B) Diabetes mellitus
Answer:
A) Cretinism: Hypothyroidism during pregnancy causes defective development and maturation of the growing baby leading to stunted growth (cretinism), mental retardation, low intelligence quotient, abnormal skin, deaf-mutism, etc.

B) Diabetes mellitus: Prolonged hyperglycemia leads to a complex disorder called diabetes mellitus which is associated with loss of glucose through urine and formation of harmful compounds known as ketone bodies.

Question 3.
What is acromegaly ? Name the hormone responsible for this disorder.
Answer:
Excess secretion of GH in adults especially in middle age can result in severe disfigurement (especially face) called Acromegaly.

  • Acromegaly may lead to serious complications and premature death if unchecked.
  • It is due to hypersecretion of growth hormone (GH) in adults.

Question 4.
Which hormone is called antidiuretic hormone? Write the name of the gland that releases it.
Answer:
Vasopressin hormone is called antidiuretic hormone (ADH). It is synthesized in hypothalamus, stored and released from posterior pituitary.

Question 5.
Name the endocrine gland that degenerates in old individuals. What important role does it play in the immune system?
Answer:
Thymus gland: It secretes thymosin hormone. It affects the development of immune, system and maturation of T-cells, which involve in Humoral immunity and cell mediated immunity.

Question 6.
Distinguish between diabetes mellitus and diabetes insipidus.
Answer:

  • Diabetes insipidus: It is due to vasopressin deficiency. It is characterized by excessive loss of water through urine without loss of glucose, that causes dehydration.
  • Diabetes mellitus: It is due to under secretion of insulin. It is characterized by hyperglycemia, excess urine with glucose and ketone bodies.

Question 7.
What are “Islets of Langerhans” ?
Answer:

  • It is the endocrine part of pancreas. Among the pancreatic acini several/many cells are * present called islets of Langerhans.
  • It contains alpha cells (∝)- secrete glucagon, beta cells (β) – secrete insulin.

Question 8.
Which gland secretes fight or flight hormones? Where is it located?
Answer:
Epinephrine and norepinephrine. They are secreted by adrenal medulla in response to stress and emergency.

Question 9.
What are Androgens? Which cells of testes secrete them?
Answer:

  • Androgens are male sex hormones, e.g.: Testosterone.
  • They are secreted by Leydig cells of testes (or) interstitial cells of Leydig.

Chemical Coordination and Integration Questions and Answers AP Inter 1st Year Zoology Chapter 9

Question 10.
What is erythropoietin? What is its function?
Answer:
The juxtaglomerular cells of the kidneys secrete a hormone called erythropoietin, which stimulates erythropoiesis (formation of RBC).

V. Short Question Answer

Question 1.
List out the names of the endocrine glands present in human beings and mention the hormones they secrete.
Answer:

Name of the endocrine glandHormones
Pituitary gland1) Growth hormone(GH).
2) Prolactin.
3) Thyroid stimulating hormone(TSH).
4) Adrenocorticotropic hormone (ACTH).
5) Follicle stimulating hormone (FSH).
6) Luteinizing hormone,
1. Melanocyte stimulating hormone(MSH)
1. Oxytocin 2. Vasopressin (ADH).
Pineal glandMelatonin
Thyroid glandThyroxine, Calcitonin
Parathyroid glandsParathormone (PTH)
Thymus glandThymosins
Adrenal glandsGlucorticoids, Mineralocorticoids,
Androgens, Adrenaline, noradrenaline
PancreasGlucagon, Insulin
TestesTestosterone
OvariesEstrogen, Progesterone

Question 2.
Diagrammatically indicate the location of various endocrine glands in the human body.
Answer:

Chemical Coordination and Integration Questions and Answers AP Inter 1st Year Zoology Chapter 9 1

Question 3.
Write short notes on the functions of the following hormones.
a) Parathyroid hormone
b) Aldosterone
c) Thymosins
d) Insulin
Answer:
a) Parathyroid hormone:

  • In humans, four parathyroid glands are present on the back side of the thyroid gland, one pair each in the two lobes of the thyroid.
  • The parathyroid glands secrete a peptide hormone called Parathyroid hormone (PTH). The secretion of PTH is regulated by the circulating levels of calcium ions.
  • Parathyroid hormone (PTH) increases the Ca2+ levels in the blood. PTH acts on bones and stimulates the process of bone resorption (dissolution / demineralization).
  • PTH also stimulates reabsorption of Ca2+ by the renal tubules and increases Ca2+ absorption from the digested food. It is clear that PTH is a hypercalcemic hormone, i.e., it increases the blood Ca2+ levels.
  • Along with TCT, it plays a significant role in calcium balance in the body.

b) Aldosterone:

  • Aldosterone is the main mineralocorticoids in our body.
  • Aldosterone acts mainly at the renal tubules and stimulates the reabsorption of Na+ and water and excretion of K+ and phosphate ions.
  • Aldosterone helps in maintenance of electrolytes, body fluid volume, osmotic pressure and blood pressure.

c) Thymosins:

  • The thymus gland is a lobular structure located between lungs behind sternum on the ventral side of the aorta.
  • The thymus plays a major role in the development of the immune system.
  • This gland secretes the peptide hormones called Thymosins.
  • Thymosins play a major role in the differentiation of T-lymphocytes, which provide cell-mediated immunity.
  • In addition, Thymosins also promote production of antibodies to provide humoral immunity.
  • Thymus is degenerated in old individuals resulting in a decreased production of Thymosins. As result, the immune responses of old persons become weak.

d) Insulin:

  • Insulin is a peptide hormone, which plays a major role in the regulation of glucose homeostasis.
  • Insulin acts mainly on hepatocytes and adipocytes (cells of adipose tissue), and enhances cellular glucose uptake and utilization.
  • Insulin also stimulates conversion of glucose to glycogen (glycogenesis) in the target cells.
  • The glucose homeostasis in blood is thus maintained jointly by the two-insulin and Glucagon.

Question 4.
Write a note on the mechanism of hormone action.
Answer:

  • Hormones produce their effect on target tissues by binding to specific proteins called hormone receptors located in the target tissue.
  • Hormone receptors presen t on the cell membrane of the target cells are called membrane bound receptors and the receptors present inside the target cell are called Intracellular receptors, mostly nuclear receptors (Present in the nucleus).
  • Binding of a hormone to its receptor leads to the formation of a hormone-receptor complex.
  • Each receptor is specific to one hormone only and hence receptors are specific.
  • Hormone-receptor complex formation leads to certain biochemical changes in the target tissue.
  • Target tissue metabolism and hence physiological function are regulated by hormones.

On the basis of their chemical nature, hormones can be divide into groups.

a) Peptide, Polypeptide, Protein hormones (e.g., Insulin, Glucagon, Pituitary hormones, Hypothalamic hormones), TCT, PTH, Thymosins.
b) Steroids (e.g., Cortisol, Testosterone, Estradiol and Progesterone).
c) Iodothyronines (Thyroid hormones).
d) Amino-acid derivatives or biogenic amines (e.g., Epinephrine).

  • Hormones which interact with membrane-bound receptors normally do not enter the target cell, but generate second messengers (e.g., Cyclic AMP, IP3, Ca+ etc.). Which in turn regulate cellular metabolism.
  • Hormones which interact with intracellular receptors (e.g., Steroid, Iodothyronines, etc.) mostly regulate gene expression or chromosome function by the interaction of hormone-receptor complex with the genome. .
  • Cumulative biochemical actions result in physiological and developmental effects.

Chemical Coordination and Integration Questions and Answers AP Inter 1st Year Zoology Chapter 9 2

Chemical Coordination and Integration Questions and Answers AP Inter 1st Year Zoology Chapter 9 3

Question 5.
Describe the role of hypothalamus as a neurosecretory endocrine organ.
Answer:

  • It is the Master Endocrine gland of the body.
  • The hypothalamus basal part of Diencephalon (part of fore brain) and hypothalamus regulates a wide spectrum of body functions. It contains several groups of neurosecretory cells called nuclei, which produce hormones.
  • These hormones regulate synthesis and secretion of anterior pituitary hormones.
  • However, these hormones produced by hypothalamus are of 2 types.

Releasing hormones (stimulates secretion of pituitary hormones) and inhibiting hormones (Inhibit secretions of pituitary hormones).

  • For e.g., a hypothalamic hormone called Gonadotrophin releasing hormone (GnRH) stimulates to anterior pituitary for synthesis and release of Gonadotrophins (FSH/LH).
  • On the other hand Somatostatin (Growth hormone inhibiting hormone) from hypothalamus inhibits release of growth hormone from anterior pituitary.
  • These hormones (Releasing hormone or Inhibiting hormone) originating in hypothalamic neurons, pass through axons of neuron of hypothalamic nuclei and are released from their nerve endings into blood vessels.
  • These reach anterior pituitary gland through a portal circulatory system and regulate functions of anterior pituitary.
  • Posterior pituitary is under direct neural regulation of hypothalamus.

Question 6.
Give an account of the secretions of the pituitary gland.
Answer:
The hormones secreted by the pituitary gland.

Adenohypophysis:

  • Follicle-stimulating hormone (FSH).
  • Growth hormone (GH)
  • Luteinising hormone (LH).
  • Thyroid-stimulating hormone (TSH).
  • Adrenocorticotropin hormone (ACTH).

Intermediate lobe:

  • Melanocyte-stimulating hormone (MSH).

Neurohyophysis:

  • Oxytocin.
  • Anti-diuretic hormone (Vasopressin).

Chemical Coordination and Integration Questions and Answers AP Inter 1st Year Zoology Chapter 9

Question 7.
Explain how hypothyroidism and hyperthyroidism can affect the body. [March-26]
Answer:
Hypothyroidism:

  • It is a condition in which production of thyroid hormones T3 & T4 decrease.
  • It is characterized by enlargement of thyroid gland called as ‘Simple goiter’.
  • Inadequate supply of iodine or impairment in the thyroid glands leads to this condition.
  • Hypothyroidism during pregnancy leads to developmental disorder in baby called ‘cretinism’.
  • Untreated congenital hypothyroidism leads to thyroid dwarf characterized by stunted growth, mental retardation, low IQ, abnormal skin, deafness, mutism etc.
  • Hypothyroidism in adults results in myxedema-characterized by lethargy, mental impairment, puffmess of face, dry skin etc.

Hyperthyroidism:

  • It is a condition in which production of thyroid hormones T3 & T4 abnormally increase.
  • Overactivity of thyroid is due to cancer of the gland or nodule development.
  • In adults it causes exophthalmic goiter-characterized by protruded eye balls.
  • It also effects the physiology of the body like increased BMR (Basal metabolic rate) etc.

I. Multiple Choice Questions

Question 1.
Which of the following is not an endocrine gland ?
1. Pituitary
2. Pineal
3. Pancreas
4. Salivary glands
Answer:
4. Salivary glands

Question 2.
The posterior pituitary is under the direct neural regulation of the
1. Hypothalamus
2. Cerebellum
3. Epithalamus
4. Medulla oblongata
Answer:
1. Hypothalamus

Question 3.
The pituitary gland is located in a bony cavity called
1. Glenoid cavity
2. Acetabulum
3. Sella tursica
4. Pars intermedia
Answer:
3. Sella tursica

Question 4.
Oxytocin and vasopressin are synthesized in
1. Posterior pituitary
2. Anterior pituitary
3. Hypothalamus
4. Thyroid
Answer:
3. Hypothalamus

Question 5.
Excess secretion of growth hormone in adults leads to
1. Dwarfism
2. Acromegaly
3. Graves’ disease
4. Addison’s disease
Answer:
2. Acromegaly

Question 6.
Which hormone stimulates contractions of the uterus at the time of child birth and milk ejection from the mammary glands ?
1. Vasopressin
2. Oxytocin
3. Thyroxine
4. Insulin
Answer:
2. Oxytocin

Question 7.
Assertion(A): Vasopressin is called antidiuretic hormone.
Reason (R): It reduces loss of water through urine.
1. Both (A) and (R) are true, and R is the correct explanation of (A).
2. Both (A) and (R) are true, but R is not the correct explanation of (A).
3. (A) is true, but (R) is false.
4. (A) is false, but (R) is true.
Answer:
1. Both (A) and (R) are true, and R is the correct explanation of (A).

Question 8.
Match the following:

Column – IColumn – II
a) T4i) Hypothalamus
b) PTHii) Thyroid
c) GnRHiii) Pituatory
d) LHiv) Parathyroid

1. (a)-ii, (b)-iv, (c)-i, (d)-iii
2. (a)-i, (b) iii, (c)-iv, (d)-ii
3. (a)-iii, (b)-ii, (c)-iv, (d)-i
4. (a)-iv, (b)-iii, (c)-i, (d)-ii
Answer:
1. (a)-ii, (b)-iv, (c)-i, (d)-iii

Question 9.
Circulating levels of calcium ions regulate the secretion of
1. Parathyroid hormone
2. Adrenaline
3. Insulin
4. Glucagon
Answer:
1. Parathyroid hormone

Question 10.
Prolonged hyperglycemia leads to
1. Diabetes insipidus
2. Diabetes mellitus
3. Addison’s disease
4. Cretinism
Answer:
2. Diabetes mellitus

Question 11.
Which of the following is not a symptom of Cretinism ?
1. Stunted growth
2. Low IQ
3. Deafness and mutism
4. Decalcification of bones
Answer:
4. Decalcification of bones

Question 12.
Which of the following is mismatched?
1. Hypothyroidism – Goitre.
2. Hyperthyroidism – Graves’ disease.
3. Hypersecretion of corticoids – Addison’s disease.
4. Hypersecretion of growth hormone – Gigantism.
Answer:
3. Hypersecretion of corticoids – Addison’s disease.

Chemical Coordination and Integration Questions and Answers AP Inter 1st Year Zoology Chapter 9

Question 13.
The hormone that stimulates the secretion of HCl and pepsinogen from gastric glands.
1. Gastrin
2. Insulin
3. Secretin
4. Cholecystokinin
Answer:
1. Gastrin

Question 14.
Which of the following hormones is an amino acid derivative ?
1. Insulin
2. Glucagon
3. Epinephrine
4. Growth hormone
Answer:
3. Epinephrine

Question 15.
Which of the following does not act as a second messenger in hormonal action ?
1. Cyclic AMP
2. IP3
3. FSH
4. Ca+2
Answer:
3. FSH

II. Fill in the Blanks

Question 1.
The non-nutrient chemicals which act as intercellular messengers are called ________________.
Answer:
Hormones

Question 2.
Over secretion of ________________ hormone leads to gigantism.
Answer:
Growth

Question 3.
The composite gland that acts as both exocrine and endocrine gland is ________________.
Answer:
Pancreas

Question 4.
Follicle stimulating hormone and ________________ hormone are called gonadotropins.
Answer:
Luteinizing

Question 5.
Iodine is essential for the synthesis of ________________ hormones.
Answer:
Thyroid

Question 6.
The main mineralocorticoid produced by the adrenal cortex in the human body is
________________.
Answer:
Aldosterone

Question 7.
Basal metabolic rate is regulated by ________________ hormones.
Answer:
Thyroid

Question 8.
The enlargement of ________________ gland is called Goitre.
Answer:
Thyroid

Question 9.
Chemically cortisol is a ________________ hormone.
Answer:
Steroid

Question 10.
Underproduction of glucocorticoids by adrenal cortex leads to ________________ disease.
Answer:
Addison’s

III. One Word Answer Questions

Question 1.
What are the secretions of the endocrine glands called ?
Answer:
Hormones.

Question 2.
Which gland produces melatonin hormone?
Answer:
Pineal gland.

Question 3.
Name the bilobed gland located on either side of the trachea.
Answer:
Thyroid.

Question 4.
How many parathyroid glands are found in the human body ?
Answer:
Four (4)

Question 5.
Which cells of Islets of Langerhans secrete glucagon hormone ?
Answer:
∝ (alpha) cells.

Question 6.
Which mineral is essential for the synthesis of thyroid hormones ?
Answer:
Iodine.

Chemical Coordination and Integration Questions and Answers AP Inter 1st Year Zoology Chapter 9

Question 7.
Which disorder is treated with insulin therapy ?
Answer:
Diabetes mellitus.

Question 8.
Which hormone supports pregnancy in women ?
Answer:
Progesterone.

Neural Control and Coordination Questions and Answers AP Inter 1st Year Zoology Chapter 8

Regular practice with AP Inter 1st Year Zoology Study Material Chapter 8 Neural Control and Coordination Questions and Answers helps students stay prepared for examinations.

AP Inter 1st Year Zoology 8th Lesson Neural Control and Coordination Questions and Answers

IV. Very Short Answer Questions

Question 1.
Distinguish between afferent and efferent nerve fibres.
Answer:
The nerve fibres of the PNS are of two types.

a) Afferent fibres (sensory): The afferent nerve fibres transmit impulses from tissues/ organs to the CNS.
b) Efferent fibres (Motor): The efferent fibres transmit regulatory impulses from CNS to concerned tissues/ organs.

Question 2.
Where do we find myelinated and non-myelinated nerve fibres ?
Answer:

  • Myelinated nerve fibres are found in spinal and cranial nerve. Spinal/cranial nerves form SNS.
  • Unmyelinated nerve fibre are commonly found in autonomous and somatic neural systems.

Question 3.
Distinguish between unipolar and bipolar neurons.
Answer:

  • Unipolar: Cell body with one axon, found usually in embryonic stage.
  • Bipolar: One axon and one dendrite eg: retina of eye and olfactory membrane in nose.

Question 4.
Name the three cranial meninges covering the human brain.
Answer:
The skull of the brain is covered by cranial meninges consisting of an outer layer called Duramater (fibrous), a very thin middle layer called arachnoid and an inner layer which is in contact with the brain tissue called piamater (vascular).

Question 5.
What is corpus callosum?
Answer:

  • Corpus callosum is a transverse band internal connection between two cerebral hemispheres beneath the cerebral cortex.
  • It is made up of a wide, flat bundle of myelinated fibres. It brings co-ordination between two cerebral hemispheres.

Question 6.
What is a synapse?
Answer:
Synapse: It is formed by the membranes of a pre-synaptic and a post-synaptic neuron that may or may not be separated by a gap known as the synaptic cleft. There are two types of synapses, namely chemical synapses and electrical synapses.

Question 7.
Distinguish between the grey matter and the white matter of the central neural system.
Answer:

  • Grey matter, primarily composed of neuronal cell bodies and dendrites.
  • White matter, composed mainly of myelinated axons.

Neural Control and Coordination Questions and Answers AP Inter 1st Year Zoology Chapter 8

Question 8.
What are the corpora quadrigemina?
Answer:

  • Dorsal portion (posterior) of the mid brain consists mainly of four round swellings (lobes) called as corpora quadrigemina.
  • One pair is superior colliculi (visual activity) and one pair inferior colliculi (auditory activity) both are a part of corpora quadrigemina.

V. Short Answer Questions

Question 1.
Draw a labeled diagram of the human brain.
Answer:

Neural Control and Coordination Questions and Answers AP Inter 1st Year Zoology Chapter 8 1

Question 2.
Compare the following.
a) Central neural system (CNS) and Peripheral neural system (PNS).
b) Resting potential and Action potential.
Answer:
a) Central neural system (CNS) and Peripheral neural system (PNS)

Central neural system (CNS):

  • The spinal cord is protected by the vertebral column, whereas the brain is protected by the skull.
  • Consists of the spinal cord and the brain.
  • Processes information and regulates the responses to impulses.

Peripheral neural system (PNS):

  • Nerves of PNS pass impulses to the CNS and responses from the CNS to various structures of the body.
  • It consists of the spinal nerves and the cranial nerves.
  • It is divided into the autonomic nervous system and the somatic nervous system.

B) Resting potential and Action potential

Resting potential:

  • When the neuron is at the resting phase, it is the potential difference across membrane.
  • To maintain the resting potential, the sodium-potassium ATPase pump is activated, sending Na+ ions outside the neuron.
  • Permeability of K+ ions is observed to be more by the plasma membrane of neurons.
  • The exterior side of the neuron is positively charged, while the interior side is negatively charged.

Action potential:

  • When the neuron is triggered, it is the potential difference across the membrane.
  • It functions in a reverse pattern wherein the sodium-potassium ATPase pump sends Na+ ions to the neuron.
  • The exterior side of the neuron is negatively charged, and the interior side of the neuron is positively charged.
  • Permeability of Na+ ions is observed to be more by the plasma membrane of the neurons.

Question 3.
Give a brief account of the mechanism of synaptic transmission.
Answer:
Axon ending transfer nerve impulse to dendrite/cell body/axon of other neuron or to effector organ (e.g. muscle cell)

  • A nerve is transmitted from one neuron to another through junctions called synapses.
  • A synapse if formed by membranes of a pre-synaptic neuron (previous neuron) and a post-Synaptic neuron (next neuron), which may or may not be separated by a gap called synaptic cleft.

Diagram showing axon terminal and synapse

Neural Control and Coordination Questions and Answers AP Inter 1st Year Zoology Chapter 8 2

There are two types of synapses, electrical synapses and chemical synapses.

1. Electrical synapses: The membrane of the pre and postsynaptic neurons are in very close proximity. Electrical current can flow directly from one neuron into other across these synapses.

  • Transmission of an impulse in this case is very similar to impulse conduction along a single axon (Impulse directly transmitted from one neuron to another by making electric circuit).
  • Impulse transmission across it is always faster than across a chemical synapse.
  • Electrical synapses are rare in our system (but present in cardiac muscle fibre).
  • Gap between two neurons is very less in these synapses and it is less energy consuming and there is no synaptic cleft. This synapse does not involve neuro transmitters.

2. Chemical synapse: The membrane of pre and post synaptic neurons is separated by a fluid space called synaptic cleft.

  • Gap between two neurons is more, so synaptic cleft is present, impulse conduction is slow than electrical synapse and it is more energy consuming conduction. Most synapses in our neural system are of this kind.
  • Chemicals or neurotransmitters are involved in the transmission of impulse at these synapses. The axon terminals contain vesicles filled with these neurotrans¬mitters.
  • When an impulse/action potential arrives at axon terminal then voltage gated calcium channel open at terminal or synaptic knob and calcium ions enters in axon from extracellular fluid, this stimulates movement of synaptic vesicles towards pre synaptic membrane where they fuse with pre-synaptic membrane so, vesicles release their neurotransmitters (by exocytosis) in synaptic cleft.
  • Released neurotransmitters bind their specific receptors, present on post-synaptic membrane. This binding opens ion channels on post synaptic membrane and allowing entry of ions which can generate a new potential in post-synaptic neuron
  • New potential developed may be either excitatory or inhibitory depending on type of Neuro-transmitters.

Question 4.
Describe the structure of a multipolar neuron with a labeled diagram.
Answer:
A neuron is a microscopic structure composed of three major parts, namely cell body, dendrites and axon.

Cell body:

  • The cell body contains cytoplasm with typical cell organelles and certain granular bodes called Nissl’s granules (mass of ribosome’s, RER, these help in protein formation).
  • It also contains neuro-fibrils and provides support to neuron.

Dendrites (short fibre):

  • Which branch repeatedly and projects out from cell body, these also contain Nissl’s granules, and are called dendrites. These fibers transmit impulses towards the cell body.
  • These are receiving end of information (response/stimuli) so known as afferent process.

Axon:

  • It is a long fibre and distal end of which is branched.
  • Each branch terminates as a bulb like structure called synaptic knob which possess synaptic vesicles containing neurotransmitters.
  • The axon transmits nerve impulses away from cell body to a synapse (where two neurons meet) or to a neuro-muscular junction (Point of contact between neuron to muscle).
  • Axon are delivering end of information (Stimulus/response) so known as efferent process.
  • Axon part where, myelin sheath is absent is known as node of Ranvier but neurilemma is present (Layer of Schwann cell) at this place.
  • In myelinated neuron, Schwann secretes myelin sheath which acts as electrical insulator.
  • Based on the number of axon and dendrites, the neurons are divided into three types.
    • Multipolar: One axon and two or more dendrites, found in cerebral cortex.
    • Bipolar: One axon and one dendrite eg: retina of eye and olfactory membrane in nose.
    • Unipolar: cell body with one axon, found usually in embryonic stage.

Pseudo unipolar: Present in dorsal root ganglia of spinal cord.

  • On the basis of myelin sheath there are two types of axons, namely Myelinated and Non-Myelinated.
  • The myelinated nerve fibers are enveloped with Schwann cells, which form myelin sheath around the axon.
  • The gaps between two adjacent myelin sheaths are called Nodes of Ranvier.
  • Myelinated nerve fibers are found in spinal and cranial nerve. Spinal/cranial nerves form SNS.
  • Unmyelinated nerve fiber is enclosed by Schwann cell that does not form a myelin sheath around the axon, and is commonly found in autonomous and somatic neural systems.

Structure of Neuron

Neural Control and Coordination Questions and Answers AP Inter 1st Year Zoology Chapter 8 3

Question 5.
Differentiate between
a) Myelinated and Non-myelinated axons.
b) Dendrites and Axons.
a) Myelinated and Non-myelinated axons.
Answer:
On the basis of myelin sheath there are two types of axons, namely Myelinated and Non-Myelinated.

  • The myelinated nerve fibres are enveloped with Schwann cells, which form myelin sheath around the axon.
  • The gaps between two adjacent myelin sheaths are called Nodes of Ranvier.
  • Myelinated nerve fibres are found in spinal and cranial nerve. Spinal/cranial nerves form SNS.
  • The sheath acts as insulator, prevent energy loss in nerve transmission, these neurons show salutatory conduction.
  • Unmyelinated nerve fibre is enclosed by Schwann cell that does not form a myelin sheath around the axon, and is commonly found in autonomous and somatic neural systems.

b) Dendrites and Axons.
Answer:

Dendrites: Dendrites are short processes, They are branched, Nissl’s granules are found in neuroplasm, They carry impulses towards the cell body of the neuron.

Axons: They are long processes, Axons may or may not be branched, Nissl’s granules are absent in neuroplasm, They carry impulses away from the cell body to the neuron.

Neural Control and Coordination Questions and Answers AP Inter 1st Year Zoology Chapter 8

Question 6.
Differentiate between
a) Thalamus and Hypothalamus.
b) Cerebrum and Cerebellum.

a) Thalamus and Hypothalamus.
Answer:
Thalamus: Consists of grey matter only and is located above the midbrain, It has the centre for sensations namely – cold, pain, heat. It does not secrete hormones.

Hypothalamus: Consists of white and grey matter and is located at the base of the thalamus, it has the centre for sensations namely – regulating body temperature, homeostasis, blood pressure. It secretes several hormones that control the activity of pituitary gland.

b) Cerebrum and Cerebellum.
Answer:
Cerebrum: It is a portion of the forebrain, The brain is majorly covered by the cerebrum, It is divided into two cerebral hemispheres, It is the centre for intelligence and memory.

Cerebellum: It is part of the hindbrain, The second largest part of the brain after the cerebrum, It is divided into three lobes, It is the centre for posture and body equilibrium.

Question 7.
Draw a labeled diagram of multipolar neuron.
Answer:

Neural Control and Coordination Questions and Answers AP Inter 1st Year Zoology Chapter 8 3

VI. Long Answer Questions

Question 1.
Give a brief account of the structure and functions of human brain with a neat labeled
diagram.
Answer:

  • Brain is central information processing organ of our body, and acts as the command and control system.
  • It controls the voluntary movements, balance of the body, functioning of vital involuntary organs (Ex: Lungs, Heart, Kidneys), thermoregulation, hunger and thirst, circadian rhythms (12 hours) of our body, and also control activities of several endocrine glands and human behaviour.
  • It is also the site for processing of vision, hearing, speech, memory, intelligence, emotions and thoughts.
  • The human brain is well protected by the skull.
  • Inside the skull the brain is covered by cranial meninges consisting of an outer layer called Duramater (fibrous), a very thin middle layer called arachnoid and an inner layer which is in contact with the brain tissue called piamater (vascular).
  • The brain can be divided into three major parts -Fore brain, mid brain and hind brain.

1. Fore brain: It consists of cerebrum, thalamus and hypothalamus.

Cerebrum:

  • It forms major part of the human brain.
  • A deep cleft (longitudinal fissure) divides cerebrum into longitudinally into two halves known as left and right cerebral hemispheres.
  • Both hemispheres are connected by a tract of nerve fibres called Corpus callosum.
  • The outer layer of cells which covers cerebral hemispheres is cerebral cortex, which is thrown (divided) into prominent (visible) folds known as gyri (outgrowth) and sulci (Depression).
  • Cerebral cortex is outer part and contains grey matter, its greyish appearance is due to more neuronal cell bodies and non-myelinated neurons.
  • Cerebral cortex contains rhotor areas to control voluntary activities and has association areas; these are neither clearly sensory nor motor in function but responsible for complex functions like inter sensory associations (detection of many senses at a time), memory and communication.
  • Cerebral medulla constitutes the inner part of cerebral hemisphere. It has tracts of nerve fibers, covered with the myelin sheath.
  • They give an opaque white appearance to this layer and hence are called as white matter.
  • Cerebrum wraps (cover) around a structure called thalamus, which is major coordinating center for sensory and motor signaling.
  • Another important part of the brain are Hypothalamus Lies at the base of thalamus. It contains a number of centers which controls body temperature, urge for eating (appetite) and drinking etc.
  • It has several group of neurosecretory cells, which secrete hormones called hypothalamic hormones.
  • Inner parts of cerebral hemispheres and a group of associated deep structures like amygdale, hippocampus etc. form complex structures called limbic lobe or limbic system. Along with hypothalamus, limbic system is involved in regulation of sexual behavior, expression of emotional reactions (Excitement, pleasure and happiness, rage or anger and fear) and motivation.

2. Mid brain:

  • Located between thalamus/hypothalamus (both are part of diencephalon) of .fore brain on upper side and pons of mid brain on lower side.
  • A canal called Aqueduct passes through the mid brain.
    Dorsal portion (posterior) of the mid brain consists mainly of four round swellings (lobes) called as corpora quadrigemina.

3. Hind brain:

  • It comprises of pons, cerebellum and medulla oblongata.
  • Pons: Acts like a bridge and consists of tracts of fibres that interconnect different regions of the brain.
  • Cerebellum: It has very convoluted (folded) surface in order to provide additional space for many more neurons.

Medulla oblongata:

  • It connected to the spinal cord contains centers which controls respiration (Respiratory center), cardiovascular reflexes (cardiac center) and gastric secretions.
  • Brain stem is made of 3 major regions they are mid brain, pons and medulla oblongata.
  • Brain stem connects between the brain (cerebrum) and spinal cord.

Neural Control and Coordination Questions and Answers AP Inter 1st Year Zoology Chapter 8 1

Neural Control and Coordination Questions and Answers AP Inter 1st Year Zoology Chapter 8

Question 2.
Describe the mechanism of generation and conduction of nerve impulse through a nerve fibre with the help of diagrams.
Answer:
Diagram representation of Impulse conduction through an axon

Neural Control and Coordination Questions and Answers AP Inter 1st Year Zoology Chapter 8 4

  • Neurons are excitable cells because their membranes are in polarized state. Different types of ion channels are present on neural membrane.
  • These ion channels are selectively permeable to different ions.
  • When a neuron is not conducting any impulse.
  • In resting state, the axonal membrane is comparatively more permeable to potassium ions (because K+ leak channels are more so it flows outward more) and nearly impermeable to Na+ ions (number is less, it moves inward less) and impermeable to negatively charged proteins present in the axoplasm (these remains inside of axon).
  • The membrane is impermeable to negatively charged proteins present in the axoplasm. Consequently, the axoplasm inside the axon contains high concentration of K+ and negatively charged proteins and low concentration of Na+.
  • The fluid outside the axon contains a low concentration of K+, a high concentration of Na+ and thus form a concentration gradient. These ionic gradients across the resting membrane are maintained by the active transport of ions by the sodium-potassium pump which transports 3Na+ outwards and 2K+ into cell.
  • As a result, outer surface of axonal membrane possess a positive charge while its inner surface becomes negatively charged and this state is known as polarized-/resting state.
  • When a stimulus is applied at site A on polarized membrane at site A becomes freely permeable to Na+. This leads to a rapid influx of Na+ followed by reversal of the polarity at site A outer surface of membrane becomes negatively charged and inner side becomes positively charges.
  • The polarity of membrane at site A is thus reversed and hence depolarized.
  • The electrical potential difference across plasma membrane at site A is now called as action potential, which is also termed as a nerve impulse.
  • At sites immediately ahead the axon at site B, membrane has a positive charge on outer surface and a negative charge on its inner surface. As a result, a current flow on inner surface from site A to site B on outer surface current flows from site B to site A to complete circuit of current flow.
  • So polarity at B site is reversed hence an action potential is generated at site B.
  • Thus the impulse (action potential) generated at site A now arrives at site B. The sequence is repeated along length of axon and consequently impulse is conducted.
  • The rise in stimulus induced permeability to Na+ is extremely short lived.
  • It is quickly followed by a rise in permeability to K+.
  • With in a fraction of a second K+ diffuses outside the membrane and it restores resting potential of membrane at site of excitation and it is known as repolarization and nerve fibre becomes ready for further stimulation.

I. Multiple Choice Questions

Question 1.
Which two systems jointly coordinate and integrate all the activities of the organs in human body ?
1. Neural system and Circulatory system
2. Endocrine system and Digestive system
3. Neural system and Endocrine system
4. Respiratory system and Neural system
Answer:
3. Neural system and Endocrine system

Question 2.

Type of NeuronFound in
a) Multipolari) Embryonic stage
b) Bipolarii) Cerebral cortex
c) Unipolariii) Retina of eye

1. (a) i, (b) iii, (c) ii
2. (a) iii, (b) ii, (c) i
3. (a) ii, (b) iii, (c) i
4. (a) ii, (b) i, (c) iii
Answer:
3. (a) ii, (b) iii, (c) i

Question 3.
Sodium potassium pump transports,
1. Three K+ outwards for two Na+ into the cell.
2. Two Na+ outwards for three K+ into the cell.
3. Two K+ outwards for three Na+ into the cell.
4. Three Na+ outwards for two K+ into the cell.
Answer:
4. Three Na+ outwards for two K+ into the cell.

Question 4.
Depolarization of an axon occurs due to
1. Influx of Na+
2. Outflow of Na+
3. Influx of K+
4. Outflow of K+
Answer:
1. Influx of Na+

Question 5.
Which organ acts as “the command-and-control system of our body ?
1. Heart
2. Lungs
3. Brain
4. Kidney
Answer:
3. Brain

Question 6.
What is the correct sequence of meninges from inner to outer side ?
1. Arachnoid, Duramater, Piamater
2. Duramater, Arachnoid, Piamater
3. Piamater, Arachnoid, Duramater
4. Duramater, Piamater, Arachnoid
Answer:
3. Piamater, Arachnoid, Duramater

Question 7.
Which part of the human brain is the most developed ?
1. Cerebral cortex
2. Thalamus
3. Hypothalamus
4. Medulla
Answer:
1. Cerebral cortex

Question 8.
The limbic system is located in the
1. Cerebral hemispheres
2. Cerebellum
3. Midbrain
4. Medulla
Answer:
1. Cerebral hemispheres

Neural Control and Coordination Questions and Answers AP Inter 1st Year Zoology Chapter 8

Question 9.
What is the function of thalamus ?
1. To control body temperature.
2. To regulate hunger and thirst.
3. To act as a major coordinating centre for sensory and motor signaling.
4. To process vision and hearing.
Answer:
3. To act as a major coordinating centre for sensory and motor signaling.

Question 10.
What are the three major regions of the brain stem ?
1. Forebrain, hindbrain and cerebral cortex.
2. Forebrain, midbrain and spinal cord.
3. Cerebrum, midbrain and hindbrain.
4. Midbrain, pons and medulla.
Answer:
4. Midbrain, pons and medulla.

II. Fill in the blanks

Question 1.
____________ granules are present in the cell body of a neuron.
Answer:
Nissil’s

Question 2.
The chemicals present in the synaptic vesicles are ____________.
Answer:
Neurotransmitters

Question 3.
The gaps between two adjacent myelin sheaths are called ____________.
Answer:
Nodes of Ranvier

Question 4.
Neurons are excitable cells because their membranes are in a state.
Answer:
Polarised

Question 5.
The fluid filled space that separates the membranes of the pre-synaptic and post-synaptic neurons at a chemical synapse is ____________.
Answer:
Synaptic cleft

Question 6.
The cerebral hemispheres are connected by a tract of nerve fibres known as ____________.
Answer:
Corpus callosum

Question 7.
The canal that passes through the midbrain is called ____________.
Answer:
Cerebral aqueduct

III. One Word Answer Questions

Question 1.
What is the structural and functional unit of the neural system?
Answer:
Neuron.

Question 2.
Which fibres transmit the impulses towards the cell body in a neuron?
Answer:
Dendrites

Question 3.
Name the type of neurons with one axon and two or more dendrites.
Answer:
Multipolar neuron.

Question 4.
Which part of the eye consists of bipolar neurons?
Answer:
Retina.

Question 5.
Name the cells that form myelin sheath around the nerve fibres.
Answer:
Schwann cells.

Neural Control and Coordination Questions and Answers AP Inter 1st Year Zoology Chapter 8

Question 6.
Which type of synapses allow faster transmission of nerve impulses?
Answer:
Electrical synapses.

Question 7.
Which part of the forebrain controls body temperature, urge for eating and drinking?
Answer:
Hypothalamus.