
For systematic learning, students can include AP Inter 1st Year English Study Material and Non-Verbal Information in English Inter 1st Year in their daily study routine.
Inter 1st Year English Non-Verbal Information with Answers
Non-verbal communication has two key aspects. The first includes the elements we use while speaking – such as facial expressions, hand gestures, way of standing and sitting, and body movements. The second involves conveying information through visual formats like tables, pie charts, bar graphs, flow charts, root maps, and tree diagrams. These visual tools are highly effective in presenting information clearly, often making it easy for even common persons to understand complex data. Therefore, students should develop the ability to present information both visually and verbally for effective and comprehensive communication.
1. pie charts / diagrams
A pie chart is a type of graph that displays data in the form of a circular diagram. Each slice of the pie represents a portion of the total, showing the relative size of each category. It is a form of pictorial representation that helps illustrate how a whole is divided into different parts. The slices are often labeled with details to indicate each category’s contribution to the overall matter. To create a pie chart, both categorical variables and numerical variables are required. In this chart, the term ‘pie’ symbolizes the entire dataset, while the slices represent the individual parts that make up the whole.
Example:
Question 1.
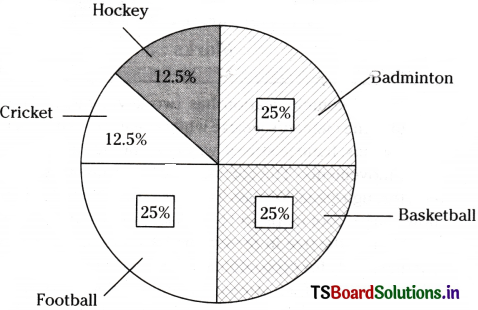
Study the following table and draw a pie diagram based on the information given in the table.
| Football | Hockey | Cricket | Basketball | Badminton |
| 10 | 5 | 5 | 10 | 10 |
Answer:
Try This:
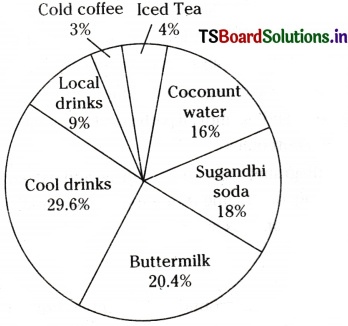
A summer survey conducted among 500 people in an area revealed their favourite beverages to beat the heat:
- Cool drinks: 148 people preferred them over natural drinks.
- Buttermilk: 102 people chose this as a healthy option.
- Sugandhi soda (Nannari): 90 people opted for it.
- Coconut water: 80 people preferred it.
- Iced tea: Chosen by 20 people.
- Cold coffee: Chosen by 15 people.
- Local drinks: The remaining participants preferred local beverages over all the above options.
Based on this data, create a pie chart to visually represent the distribution of preferences.
2. Tree diagrams
A tree diagram is a visual tool used to represent the hierarchical structure of information in a clear, pictorial form. It is called a tree diagram because its layout resembles the shape of a tree, though it is typically drawn upside down or left to right with the root at the top and branches extending downward. Tree diagrams are useful for breaking down complex information into simpler, organized parts. Here’s how you can create one:
- Choose your main concept, idea, or topic.
This should be the broadest or most general idea you want to explore. - Place the main concept at the top of the diagram.
Since tree diagrams are hierarchical, always start with the central theme at the top. - Create the first level of branches.
These branches represent the key ideas or steps directly related to main concept. - Add additional branches.
From each of the first-level branches, add more branches to represent supporting details, sub-ideas, or specific outcomes. - Continue branching until completion.
Keep expanding until all paths lead to conclusions, decisions, or final outcomes.
Tree diagrams are simple to draw and extremely helpful for planning, organizing thoughts, decision-making, and understanding complex systems.
Example
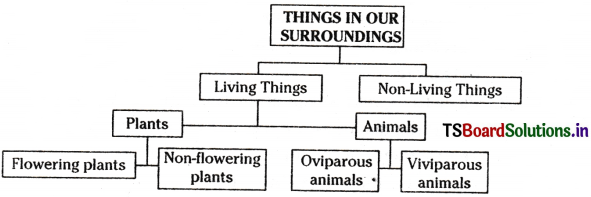
Things in our surroundings form two groups namely living things and non-livings. Living things are of two kinds, plants and animals. There are two types of plants – flowering and non-flowering plants. If we consider animals, some animals lay eggs which are called oviparous animals. Some animals give birth to their young ones. They are viviparous animals.
Read the above paragraph and draw a tree diagram based on the information.
Answer:
Try This
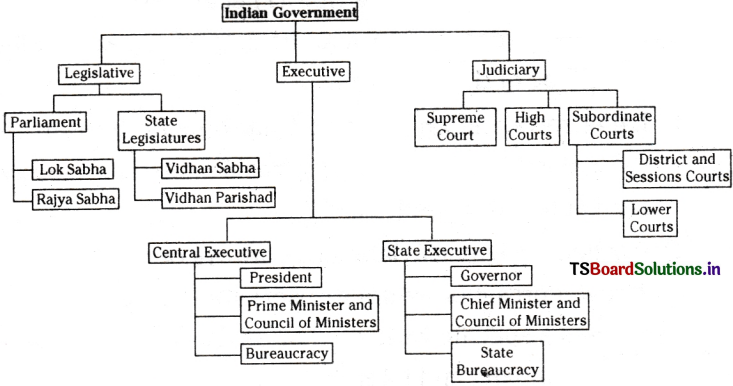
The Indian government is structured into three main branches: Legislative, Executive, and Judiciary. The Legisla¬tive branch is responsible for making laws. Further it is divided into Parliament and State legislatures. Parliament is further divided into Lok Sabha and Rajya Sabha. State legislature has Vidhan Sabha and Vidhan Parishad. The executive branch is responsible for implementing and enforcing laws. This branch is classified into Central Executive and State Executive. Central Executive has President, Prime Minister and Council of Ministers and Bureaucracy. State Executive has Governor, Chief Minister and Council of Ministers and State Bureaucracy. The judiciary interprets laws, resolves disputes, and ensures justice. Judiciary is further classified into Supreme Court, High Courts and Subordinate courts. Subordinate courts are divided into District and Sessions Courts and Lower courts.
Show the above information in a tree diagram.
Answer:

3. Tables:
A table is a systematic arrangement of information or data, typically organized in rows and columns. Tables are widely used in research, data analysis, and communication because they allow for easy comparison and interpretation of data.
Creating a Table: A Step-by-Step Guide
Drawing a table is a simple and effective way to organize data.
Follow these steps :
- Determine the purpose of the table. Identify what infor-mation you want to compare, categorize, or summarize. Knowing the purpose helps define the structure.
- Figure out the number of columns and rows needed. De¬cide how much data you have and how it should be grouped.
- Represent individual items, records, or entities in rows. Each row should contain data for a single unique obser-vation or record. This ensures clarity and avoids confusion.
- Represent attributes, categories, or variables in columns. Each column should describe a specific aspect of the data (e.g., name, age, score), and the data within each column should be of the same type.
- Label rows and columns with meaningful headers. Use clear, descriptive headings to ensure the table is easy to read and understand.
Tip : When designing a data table, always organize it so that each row represents a unique observation, and each column represents a specific variable. This makes the data easier to analyze, compare, and interpret.
Example
Four friends decided to compare their monthly expenses on different categories. Srikar spends Rs. 2000 on food. Rs. 1500 on entertainment, Rs. 1000 on travel, and Rs. 500 on skill development. Giridhar spends Rs. 2500 on food, Rs. 1000 on entertainment, Rs. 1500 on travel, and Rs. 750 on skill development. Prabhakar allocates Rs. 1800 for food, Rs. 1200 for entertainment, Rs. 800 for travel, and Rs. 600 for skill development. Siddhu spends Rs. 2200 on food, Rs. 1300 on entertainment, Rs. 900 on travel, and Rs. 700 on skill development.
Read the above passage and draw a table based on the given information.
Answer:
| Name | Money spent on | |||
| Food | Entertainment | Travel | Skill development | |
| Srikar | 2000 | 1500 | 1000 | 500 |
| Giridhar | 2500 | 1000 | 1500 | 750 |
| Prabhakar | 1800 | 1200 | 800 | 600 |
| Siddhu | 2200 | 1300 | 900 | 700 |
Try This
Convert the information given below into a table.
The University Wits were a group of influential playwrights and poets of the late 16th century who significantly shaped English literature. Among them, Christopher Marlowe (1564-1593) stood out with his masterpieces Doctor Faustus and Tamburlaine the Great known for their powerful use of blank verse and ambitious characters. Thomas Kyd (1558-1594), a pioneer of the revenge tragedy genre, gained fame with The Spanish Tragedy and Cornelia. Robert Greene (1558-1592), known for his prose romances and pastoral comedies, authored Friar Bacon and Friar Bungay and Pandosto. John Lyly (1554-1606) popularized the Euphuistic style in his works Euphues: The Anatomy of Wit and Endymion.
Thomas Nashe (1567-1601), celebrated for his satirical prose, is remembered for The Unfortunate Traveller and Pierce Penniless: His Supplication to the Devil. George Peele (1556-1596) brought lyrical and pastoral drama to the forefront with The Arraignment of Paris and David and Bethsabe. Finally, Thomas Lodge (1558¬1625), known for his romantic and pastoral literature, authored Rosalynde and A Looking Glass for London and En¬gland. Together, these writers revolutionized English drama and prose, paving the way for the golden age of Elizabethan literature.
Answer:
Here’s the information about the University Wits presented in a table:
| Playwright | Lifespan | Notable Works | literary Style/ Genre(s) |
| Christopher Marlowe | 1564-1593 | Doctor Faustus, Tamburlaine the Great | Powerful blank verse, ambitious characters |
| Thomas Kyd | 1558-1594 | The Spanish Tragedy, Cornelia | Revenge tragedy |
| Robert Greene | 1558-1592 | Friar Bacon and Friar Bungay, Pandosto | Prose romances, pastoral comedies |
| John Lyly | 1554-1606 | Euphues: The Anatomy of Wit, Endymion | Euphuistic style |
| Thomas Nashe | 1567-1601 | The Unfortunate Traveller, Pierce Penniless: His Supplication to the Devil | Satirical prose |
| George Peele | 1556-1596 | The Arraignment of Paris, David and Bethsabe | Lyrical and pastoral drama |
| Thomas Lodge | 1558-1625 | Rosalynde, A Looking Glass for London and England | Romantic and pastoral literature |
4. Bar-Graphs
A bar graph (or bar chart) is a type of graph that uses rect-angular bars to visually represent and compare data. The height or length of each bar corresponds to the value or the measure it represents, making it easy to compare different quantities at a glance.
Bar graphs are particularly useful for:
Comparing different categories of information.
Showing how values change over time.
Explaining complex data in a clear and visual format.
They are especially effective when one of the variables is categorical (such as types of fruits, countries, or age groups).
Structure of Bar Graph :
X-axis (horizontal): Usually represents the categories or time periods being measured.
Y-axis (vertical) : Represents the values or quantities corre¬sponding to each category.
Each bar is drawn with a height (or length) proportional to the value it represents, allowing for easy visual comparison.
Example
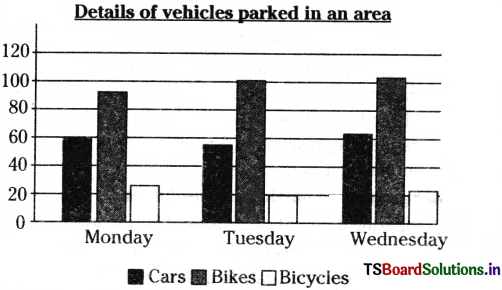
Read the following passage and draw a bar graph based on the given information.
In a parking area there are a number of vehicles being parked every day. As per the data given by the watchman of that parking area, on Monday, 60 cars, 92 bikes and 23 bicycles were parked. On Tuesday, 57 cars, 101 bikes and 20 bicycles were parked. On Wednesday, 62 cars, 105 bikes and 25 bicycles were parked.
Answer :
Try This
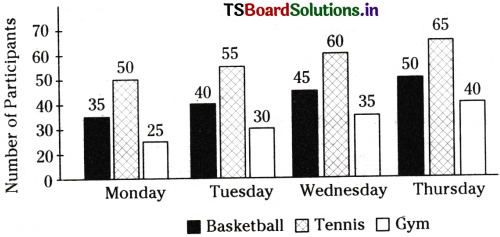
At a sports complex, the number of participants in different activities was recorded over four days. The data is as follows:
- Monday: 35 played basketball, 50 played tennis, and 25 used the gym.
- Tuesday: 40 played basketball, 55 played tennis, and 30 used the gym.
- Wednesday : 45 played basketball, 60 played tennis, and 35 used the gym.
- Thursday : 50 played basketball, 65 played tennis, and 40 used the gym.
Based on this data, draw a bar graph representing the number of participants in each activity over the four days. Use different colors for each activity to ensure clarity.
Answer:
5 . Route Maps
A route map is a detailed diagram or plan that shows the way from a starting point to a specific destination. It typi¬cally includes important information such as the starting location, destination, and the route to follow. A route map often highlights roads, streets, and key landmarks, and may also provide estimated distances or travel times. These maps are designed to help users navigate efficiently between two or more locations, making them especially useful for travel, transportation, and planning purposes.
Example
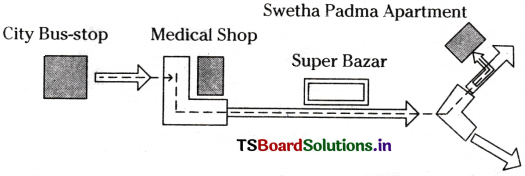
Anjali got down at city bus-stop. She should go to her friend’s house which is nearby. She called her friend Malathi and took directions to reach Malathi’s home.
Here are the directions :
- “After getting down at the city bus stop you will see a medical shop right opposite the bus-stop.”
- “Take the only road beside the medical shop.”
- “If you walk for two minutes you will see a super bazar on your left.”
- “As you cross the super bazar, you arrive at a Y-junction.”
- “There take left. After walking a few steps you will see Sweta Padma Apartments. Come into the apartment and our flat number is 402.”
Answer:
Try This
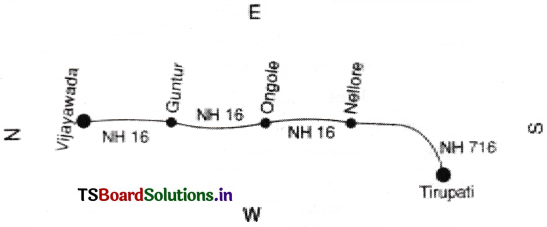
Route Map Directions : From Vijayawada to Tirupati:
- Start: Begin at Vijayawada. Take the NH16 highway heading south.
- After 30 km, you’ll pass through Guntur. Continue on NH16.
- Drive 150 km further to reach Ongole.
- Continue on NH16 for another 150 km to reach Nellore.
- Turn Off : At Nellore, take a left turn onto NH716 towards Tirupati.
- Follow NH716 for 130 km, passing through smaller towns like Naidupeta.
- You will arrive at Tirupati, where you can visit the famous Sri Venkateswara Temple.
Draw a route map from Vijayawada to Tirupati with clear labels for each landmark and a line representing the route. Use symbols for landmarks to make your map visually engaging!
Answer:
Exercises
Question 1.
In 2024 Summer Olympics in Paris, 184 countries sent their athletes to compete in various games. With 594 athletes, the United States had the largest delegation at the Olympics and won 40 gold medals, 44 silver and 42 bronze. Following the U.S, France with 572 athletes and won 16 gold, 26 silver and 22 bronze medals. Australia with 460 athletes won 18 gold, 19 silver and 16 bronze medals. Germany with 427 athletes won 12 gold, 13 silver and 8 bronze medals and India with 110 athletes won 1 silver and 5 bronze.
Answer:
| Country | Number of Athletes | Gold Medals | Silver Medals | Bronze Medals | Total |
| United States | 594 | 40 | 44 | 42 | 126 |
| France | 572 | 16 | 26 | 22 | 64 |
| Australia | 460 | 18 | 19 | 16 | 53 |
| Germany | 427 | 12 | 13 | 8 | 33 |
| India | 110 | 0 | 1 | 5 | 6 |
Question 2.
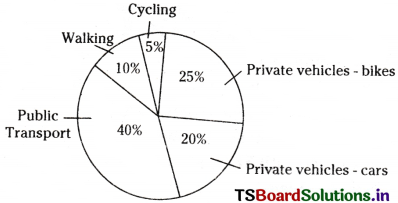
Topic : Modes of Transportation
A city survey recorded the preferred modes of daily transportation among its residents:
- Public Transport: 40% of the residents.
- Private Vehicles – cars : 20% of the residents.
- Private Vehicles – bikes : 25% of the residents.
- Cycling : 5% of the residents.
- Walking : 10% of the residents.
Represent this data as a pie chart.
Answer:
Question 3.
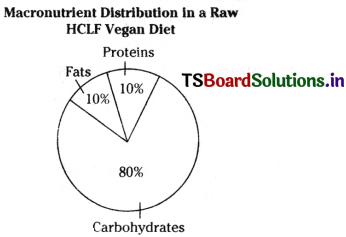
A well-planned vegan diet focuses on whole, plant-based foods and excludes all animal-derived products. A raw High- Carb, Low-Fat (HCLF) vegan diet typically includes carbohydrates, with about 80% of the total calories coming from fruits, vegetables, and other carbohydrate-rich foods. Proteins, often sourced from nuts, seeds, leafy greens, and legumes, make up approximately 10% of the calorie intake. Similarly, fats, derived from sources like avocados, nuts, and seeds, also account for 10% of total calories. This proportion supports a high-energy, nutrient-dense eating style while minimizing fat intake. Represent this data by a pie chart.
Answer:
Question 4.
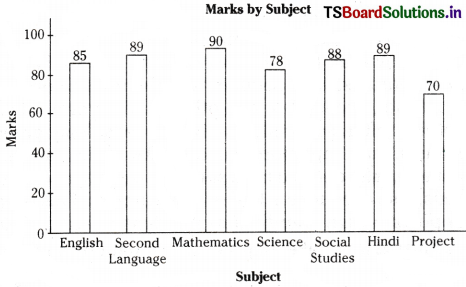
A student’s performance in different subjects is as given in the table. Convert the following table into a bar graph.
| Subject | Marks |
| English | 85 |
| Second Language | 89 |
| Mathematics | 90 |
| Science | 78 |
| Social Studies | 88 |
| Hindi | 89 |
| Project | 70 |
Answer:
Question 5.
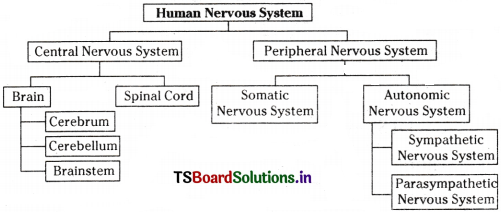
The human nervous system is classified into Central Nervous System (CNS) and Peripheral Nervous System (PNS). Brain is the centre of the CNS consisting of Cerebrum (responsible for voluntary actions, emotions, and sensory perception) and Cerebellum (controls balance and coordination). The Brainstem regulates heart rate, breathing, and reflexes and the Spinal Cord connects the brain to the rest of the body. The Peripheral Nervous System (PNS) has the following: Somatic Nervous System which controls voluntary movements (e.g., skeletal muscles) and Autonomic Nervous System (ANS). It is further divided into Sympathetic Nervous System (“Fight or flight” response) and Parasympathetic Nervous System (“Rest and digest” response).
Represent the above classification of the human nervous system in the form of a tree diagram.
Answer:
Question 6.
India experiences six primary seasons, each with unique characteristics. Spring, known as Vasanta in Hindi, occurs from March to May (corresponding to the months Chait and Baisakh in the Hindi calendar). Summer, or Grishma, spans May to July, aligning with the Hindi months Jeth and Asarh. The rainy season, referred to as Varsha, lasts from July to September and corresponds to the Hindi months Sawan and Bhadon. Autumn, called Sharada, extends from September to November, represented by the Hindi months Ashwin and Kartik. Winter, or Hemanta, is observed from November to January, covering the Hindi months Aghan and Pausha. Lastly, the cold season, known as Shishira, occurs from January to March, coinciding with the Hindi months Magha and Phalgun. Convert this information into a table diagram.
Answer:
| Season | Hindi Name | English Months | Hindi Months |
| Spring | Vasanta | March to May | Chait and Baisakh |
| Summer | Grishma | May to July | Jeth and Asarh |
| Rainy | Varsha | July to September | Sawan and Bhadon |
| Autumn | Sharada | September to November | Ashwin and Kartik |
| Winter | Hemanta | November to January | Aghan and Pausha |
| Cold Season | Shishira | January to March | Magha and Phalgun |
Question 7.
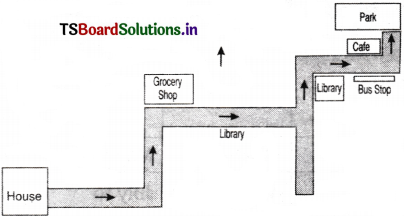
You are planning a trip from your house to the local park. Along the way, you will pass several landmarks, including a grocery store, a library, a bus stop, and a cafe. Use the following instructions to draw a route map showing your journey:
Start from your house. Turn to your left and walk till you reach a grocery shop on your right. Once you cross the grocery shop you will come to a T- junction. There take left and walk till you reach Public Library on your right. Just beside by the library there’s a pathway that leads to the bus stop. On crossing the bus-stop take left turn at the cafe. In two minutes you will reach the park.
Draw the map with clear labels for each landmark and a line to represent the route you will take. Include symbols for the landmarks to make your map visually engaging !
Answer:
Question 8.
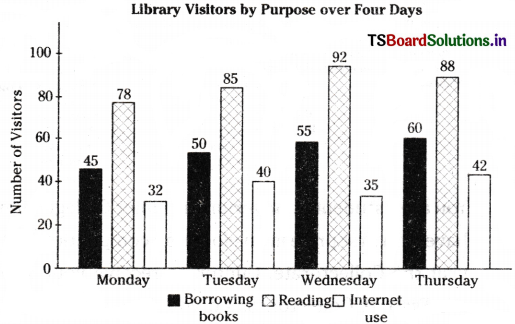
In a public library, visitors are categorized based on their purpose of visit. The librarian recorded the following data over four days:
- Monday : 45 visitors for borrowing books, 78 for reading, 32 for internet use.
- Tuesday : 50 for borrowing books, 85 for reading, 40 for internet use.
- Wednesday : 55 for borrowing books, 92 for reading, 35 for internet use.
Answer:
Question 9.
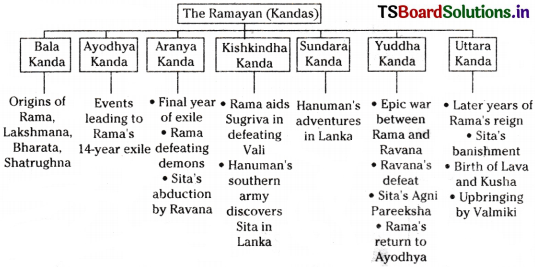
The Ramayana, divided into seven parts or kandas, narrates the life and adventures of Lord Rama and his companions. Bala Kanda details the origins of Rama and his brothers, Lakshmana, Bharata, and Shatrughna.
Ayodhya Kanda depicts the events leading to Rama’s 14-year exile. Aranya Kanda chronicles the final year of exile, featuring Rama defeating demons, Sita’s abduction by Ravana. In Kishkindha Kanda, Rama aids Sugriva in defeating Vali, and Hanuman’s southern army discovers Sita’s location in Lanka. Sundara Kanda focuses on Hanuman’s adventures, while Yuddha Kanda recounts the epic war between Rama and Ravana, culminating in Ravana’s defeat and Sita’s Agni Pareeksha. Rama’s exile ends with his celebrated return to Ayodhya. Finally, Uttara Kanda describes the later years, including Sita’s banishment, the birth of Lava and Kusha, and their upbringing by Valmiki.
Answer:
Question 10.
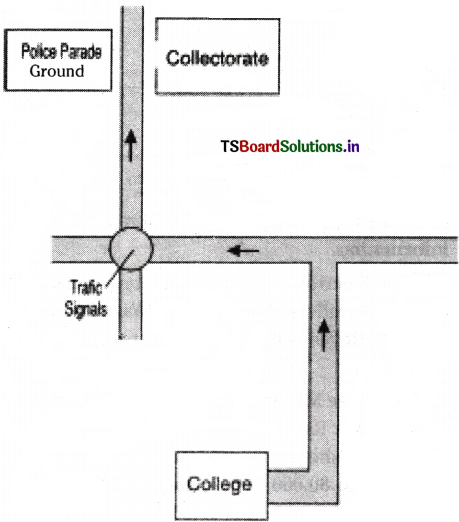
You are a student at Government Junior College, Guntur. You have won first prize in an elocution competition and need to visit the Collectorate, Guntur, to receive your award from the District Collector. Since you do not know the way to Collectorate, your friend provides you with the following directions.
Directions:
Start at Government Junior College near Naaz Centre in Sambasiva Pet, Guntur. Exit the college and turn left to reach a T-junction. At the junction, turn left and continue until you reach the traffic signals at the rossroads. There, turn right and go straight for approximately 800 metres. You will see Police Parade Ground (PPG) on your left. The Collectorate entrance gate is directly opposite the PPG.
Task: Based on the directions, draw a route map with clear labels for each landmark. Use a line to represent the path you will take and include symbols for the landmarks to make your map visually engaging.
Answer:
Question 11.
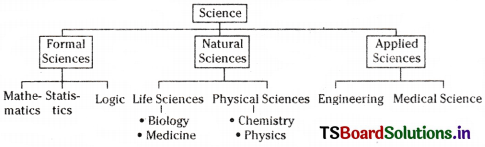
The field of science has been studied in many historic civilizations. It is broadly classified into three main branches : Formal Sciences, Natural Sciences and Applied Sciences. Formal Sciences include the subjects of Mathematics, Statistics and Logic. Natural Sciences are separated into Life Sciences and Physical Sciences. Between these, Life Sciences comprise the studies of Biology and Medicine, while Physical Sciences consist of Chemistry and Physics. Applied Sciences cover the disciplines of Engineering and Medical Science.
Draw a tree diagram to show the above data.
Answer:
Question 12.
Read the following passage and draw a table based on the information.
Silpa Electronic Store sells home appliances like Coffee Makers, Grinders, Mixers, Dish Washers, Ovens and Rice Cookers. Revenue earned by this store in the year 2024 is as follows :
210 Coffee Makers were sold for Rs. 30,000. 260 Grinders were sold for Rs. 96,000. 180 Mixers were sold for Rs. 45,000. 128 Dish Washers were sold for Rs. 3,20,000. 115 Ovens were sold for Rs. 80,000. The highest sold appliance was Rice Cookers, 460 sold for Rs. 48,000. Show the above data in a table form.
Answer:
Sales of Home Appliances
| Appliance | Quantity Sold | Revenue (Rs.) |
| Coffee Makers | 210 | 30,000/- |
| Grinders | 260 | 96,000/- |
| Mixers | 180 | 45,000/- |
| Dish Washers | 128 | 3,20,000/- |
| Ovens | 115 | 80,000/- |
| Rice Cookers | 460 | 48,000 /- |