Here students can locate TS Inter 1st Year Economics Notes Chapter 10 Basic Statistics for Economics to prepare for their exam.
TS Inter 1st Year Economics Notes Chapter 10 Basic Statistics for Economics
→ Economics is that branch of social science that studies the economic behavior of human beings.
→ In Economics, measures are known as policies. So a number of analyses of economic problems would be possible without data.
→ Statistics means numerical facts systematically collected.
→ Statistics is used in finding the relationship between the cause and effect of an economic problem.
→ Collection of data is classified into two types.
- Primary data
- Secondary data
![]()
→ There are various kinds of diagrams in common use.
- Geometric diagram
- Frequency diagram
- Line graphs diagram
→ ‘Bar’ diagram and ‘Pie’ diagram come in the category of geometric diagrams.
→ The Bar diagrams are of three types:
- Simple bar diagram 2. Multiple bar diagram 3. Subdivided bar diagram.
→ Height and length rectangular bars for each class of data.
→ It is used for comparing two or more sets of data.
→ These diagrams are used to represent various parts of the total.
→ The circle is divided into as many parts as components by drawing straight lines from the centre.
→ The measures of central tendency is a way of summarizing the data in the form of typical values. There are three most commonly used averages:
- Arithmetic Mean
- Median
- Mode
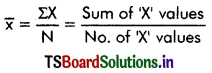
→ It is the quotient of the sum of all the items divided by the number of items.
→ Mean calculation: under ungrouped data
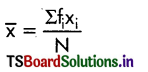
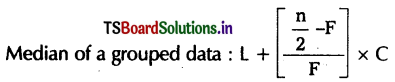
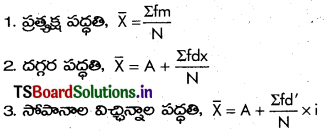
→ Mean calculating under grouped data:
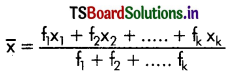
Using the symbol S for summation we get
→ Shortcut or Step deviation method for a mean of grouped data:
![]()
→ Median is the middle element when the data set is arranged in order of magnitude.
→ Mode is the most frequently observed value in the data with the highest frequency is called the mode of data.
→ Relationship among Mean, Median, and Mode:
There exist an empirical relation among mean, median, and mode.
So, Mode = 3 Median – 2 Mean
TS Inter 1st Year Economics Notes Chapter 10 అర్థశాస్త్రంలో ప్రాథమిక గణాంక శాస్త్ర భావనలు
→ గణాంక శాస్త్రాన్ని ఆంగ్లంలో ‘స్టాటిస్టిక్స్’ అని పిలుస్తారు. దీనిని రెండు అర్థాలలో వాడుతారు. ఏకవచనంలో దీనిని ‘గణాంక శాస్త్రం’ అంటారు. బహువచనంలో “సాంఖ్యా దత్తాంశం” అంటారు.
→ గణాంకశాస్త్ర పరిధిలోకి ముఖ్యంగా వచ్చే అంశాలు దత్తాంశాన్ని సేకరించడం, సమర్పించడం, విశ్లేషణ చేయడం, విపులీకరించడం మొదలగునవి.
→ అర్థశాస్త్ర అధ్యయనంలో గణాంక శాస్త్ర పరిజ్ఞానం అవసరమని J.S. మిల్, జీవాన్స్, కీన్స్ లాంటి వారు పేర్కొన్నారు. అర్థశాస్త్ర విశ్లేషణ అంతా గణాంక దత్తాంశంపై పూర్తిగా ఆధారపడి ఉంటుంది. పేదరికం, నిరుద్యోగం, ధరలు మొదలగువాటి స్వరూప, స్వభావాలు తెలుసుకొనుటకు దీనిని ఉపయోగిస్తారు.
→ గణాంక ఫలితాలు తేలికగా అవగాహన చేసుకొనుటకు చిత్రపటాలు ఉపయోగపడతాయి. అవి. ముఖ్యంగా 5 రకాలు.
- ఏకపరిమాణ చిత్రాలు
- ద్విపరిమాణ చిత్రాలు
- త్రిపరిమాణ చిత్రాలు
- పిక్టోగ్రాములు
- కార్టోగ్రాములు
→ i) సాధారణ బార్ చిత్రాన్ని ఒక చలనరాశిలో మార్పు చూపడానికి ఉపయోగిస్తారు.
ii) ఉప విభాజిత బార్పటం మొత్తం దత్తాంశంలోని భాగాలు బార్లో చూపించవచ్చు.
iii) బహుళ బారటం అంతర సంబంధమున్న దత్తాంశం ఒక పటంలో చూపడానికి ఉపయోగిస్తారు.
iv) దత్తాంశంలో మార్పులు సులభంగా గమనించడానికి శాతపు బార్ ఉపయోగిస్తారు.
![]()
→ శ్రేణులలో ఉన్న అంశాల మొత్తాన్ని అంశాల సంఖ్యతో భాగిస్తే ఉత్పన్నమయ్యే సంఖ్య అంకమధ్యమం.
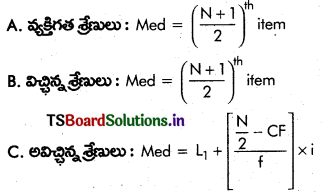
A. వ్యక్తిగత శ్రేణుల మూడు పద్ధతులు:
B. విచ్చిన్న శ్రేణులు:
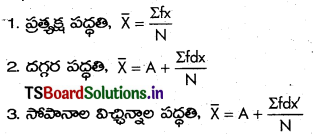
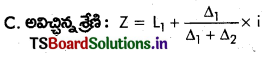
C. అవిచ్చిన్న శ్రేణులు:
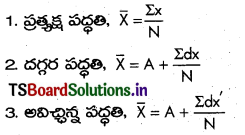
→ విభాజనాన్ని ఏ విలువ రెండు సమభాగాలుగా విభజిస్తుందో దానిని “మధ్యగతం” అంటారు.
![]()
→ శ్రేణులలో ఉన్న అంశాలలో ఏ విలువ అతి తరచుగా వస్తుందో ఆ విలువను బాహుళకం అంటారు.
A. వ్యక్తిగత శ్రేణి: Z = ఎక్కువ పర్యాయాలు వచ్చేది.
B. విచ్ఛిన్న శ్రేణి : Z = ఎక్కువ పర్యాయాలు వచ్చేది.