We are offering TS 10th Class Maths Notes Chapter 14 Statistics to learn maths more effectively.
TS 10th Class Maths Notes Chapter 14 Statistics
→ Mean :
The mean for grouped data can be found by :
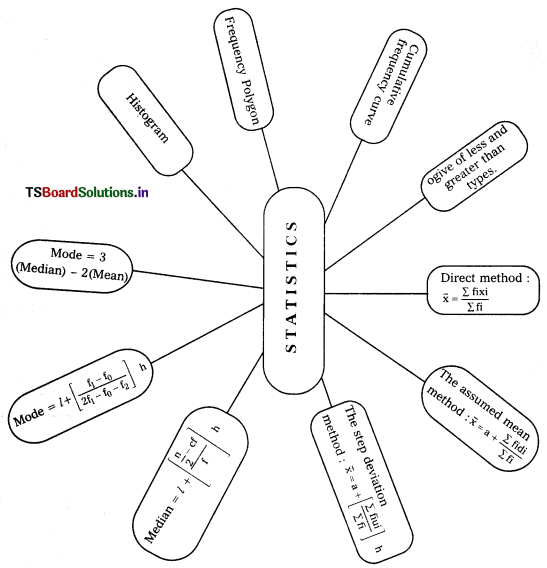
- Direct Mean: x̄ = \(\frac{\Sigma \mathrm{f}_{\mathrm{i}} \mathrm{x}_{\mathrm{i}}}{\Sigma \mathrm{f}_{\mathrm{i}}}\)
- The Assumed Mean Method: x̄ = a + \(\frac{\Sigma \mathrm{f}_{\mathrm{i}} \mathrm{d}_{\mathrm{i}}}{\Sigma \mathrm{f}_{\mathrm{i}}}\)
- The step-deviation Method: x̄ = a + \(\left[\frac{\Sigma \mathrm{f}_{\mathrm{i}} \mu_{\mathrm{i}}}{\Sigma \mathrm{f}_{\mathrm{i}}}\right]\) × h
with the assumption that the frequency of a class is centred at its mid-point, called its class mark.
→ Mode:
A mode is that value among the observations which occurs most often, that is the value of observation having the maximum frequency.
→ Median :
Median of un grouped data :
First arrange the data values of the observations in ascending order.
Then, if n is odd,
The median is the \(\left(\frac{\mathrm{n}+1}{2}\right)^{\mathrm{th}}\) observation.
And if n is even, the median is the average of the \(\left(\frac{\mathrm{n}}{2}\right)^{\text {th }}\) and the \(\left(\frac{\mathrm{n}}{2}+1\right)^{\text {th }}\) observation.
→ Measures of central tendency are :
Mean, Median and Mode.
- The mean is the most frequently used measure of central tendency because it takes into a count of all the observations and lies between the extremes, (i.e.) the largest and the smallest observations of the entire data.
- In problems, where individual observations are not important and We wish to find out a typical observation the median is more appropriate.
- ln situations, which require establishing the most frequent value or most popular item, the mode is the best choice.
- Emperial relationship between the three measures of central tendency.
Mode = 3 (Median) – 2(Mean).
![]()
→ Cummuiative frequency curve, or an ogive (of the lessthan type)
We mark the upper limits of the class intervals on the horizontal axis (X -axis) and the their corre-sponding cummuiative frequencies on the vertical axis (Y – axis), choosing a convenient scale. The scale may not be the same on both the axes. Now, we plot the points (upper limit, corresponding cummuiative frequency) on a graph paper and join them by a free hand smooth curve. The curve we get is called a cummuiative frequency curve, or an ogive (of the lessthan type).
Flow Chat:
Ronald Aylmer Fisher (1890 – 1962):
- Sir Ronald Aylmer Fisher (1890 – 1962) was an English statistician, volutionary biologist, geneticist and eugenicist.
- He was fellow of the Royal Society in 1929. Royal Medal 1938.
- Statistics is an English word is taken by an Italian word ‘Starusta’ and a Greek word ‘Statistic’.