These TS 10th Class Maths Chapter Wise Important Questions Chapter 14 Statistics given here will help you to solve different types of questions.
TS 10th Class Maths Important Questions Chapter 14 Statistics
Previous Year Exam Questions
Question 1.
Find the mean of 5, 6, 9, 10, 6, 12, 3, 6, 11, 10. (A.P. Mar. 15)
Solution:
Mean = \(\frac{\text { Sum of scores }}{\text { No.of scores }}\)
= \(\frac{5+6+9+10+6+12+3+6+11+10}{10}\)
= \(\frac{78}{10}\) = 7.8
Question 2.
Write the formula for the median of a grouped data. Explain symbol with their used meaning. (A.P. Mar. ’15)
Solution:
Median (M) = l + \(\left(\frac{\frac{\mathrm{n}}{2}-c . f}{\mathrm{f}}\right)\) × h
l = lower limit of the median class.
n = sum of the frequency
c.f = cumulative frequency of the class preceding the median class
f = frequency of the median class
h = length of the class
Question 3.
Find the median of 5, 3, 1, -4, 6, 7, 0 (A.P. June ’15)
Solution:
The given observations are 5, 3, 1, -4, 6, 7, 0
Writing the observations in ascending order, we have -4, 0, 1, 3, 5, 6, 7.
There are 7 observations. Hence, the median will be \(\left(\frac{-7+1}{2}\right)^{\mathrm{th}}\) observation
i.e., 4th observation
The 4th observation is 3.
Hence, the median is 3.
![]()
Question 4.
Find the mode of the following data : (A.P. June ’15)
| Monthly consumption | 60-80 | 80-100 | 100-120 | 120-140 | 140-160 | 160-180 | 180-200 |
| No.of consumers | 8 | 10 | 16 | 20 | 14 | 6 | 5 |
Sol:
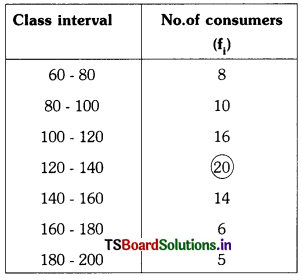
Since, the maximum number of consumers (is 20) have got monthly consumption in the interval 120 – 140, the modal class is 120 – 140.
The lower boundary (l) of the modal class = 120.
The class size (h) = 20
The frequency of modal class (f1) = 20
The frequency of the class preceding the modal class (f0) = 16.
The frequency of the class succeeding the modal class (f2) = 14.
Now, using the formula :
Mode = l + \(\left[\frac{f_1-f_0}{2 f_1-f_0-f_2}\right]\) × h
= 120 + \(\left[\frac{20-16}{2 \times 20-16-14}\right]\) × 20
= 120 + \(\left[\frac{4}{40-30}\right]\) × 20
= 120 + \(\left[\frac{4}{10}\right]\) × 20 = 120 + 8 = 128
Question 5.
Find the mode of a5, 6, 9, 6, 12, 3, 6, 11, 6, 7 (A.P. Mar. ’16)
Solution:
In the given data 5, 6, 9, 6,12, 3, 6, 11, 6 and 7 the frequency of 6 is maximum.
Hence, mode = 6
Question 6.
Find the mean of first ‘n’ natural numbers. (A.P. Mar. ’16)
Solution:
Mean = \(\frac{\text { Sum of first ‘n’ natural number }}{n}=\frac{\Sigma n}{n}=\frac{n(n+1)}{2(\mathrm{n})}=\frac{n+1}{2}\)
∴ \(\frac{n+1}{2}\) is the average (mean) of first ‘n’ natural number.
Question 7.
| Class Interval | 10-25 | 25-40 | 40-55 | 55-70 | 70-85 | 85-100 |
| Frequency | 2 | 3 | 7 | 6 | 6 | 6 |
How do you find the deviation from the assumed mean for the above data ? (T.S. Mar. ’15)
Solution:
The assumed value in calculation of mean of a grouped data is the mid value of the class interval which has maximum frequency.
![]()
Question 8.
In a village, an enumerator has surveyed for 25 households. The size of the family and the number of families is tabulated as follows : (T.S. Mar ’15)
| Size of the family (No. of members) | 1-3 | 3-5 | 5-7 | 7-9 | 9-11 |
| No. of families | 6 | 7 | 9 | 2 | 1 |
Find the mode of the data.
Solution:
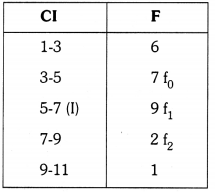
Mode = l + \(\left(\frac{f_1-f_0}{2 f_1-f_0-f_2}\right)\) × h
= 5 + \(\left[\frac{9-7}{18-7-2}\right]\) × 2
= 5 + \(\frac{4}{9}\)
= 5 + 0.44 = 5.44
Question 9.
Daily expenditure of 25 householders is given in the following table: (T.S. Mar. ’15)
| Daily expenditure of a household (in rupees) | 100-150 | 150-200 | 200-250 | 250-300 | 300-350 |
| No.of households | 4 | 5 | 12 | 2 | 2 |
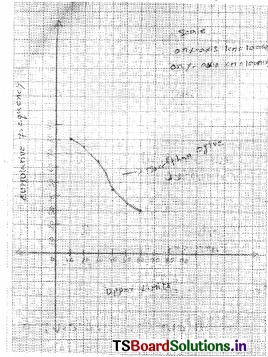
Draw a “less than type” cumulative frequency ogive curve for this data.
Solution:
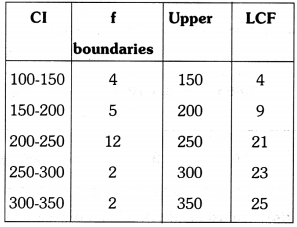
Points (150, 4) (200, 9) (250, 21) (300, 23) (350, 25)
Question 10.
Consider the following distribution of daily wages of 50 workers of a factory.
| Daily wages | 200-250 | 250-300 | 300-350 | 350-400 | 400-450 |
| Number of workers | 6 | 8 | 14 | 10 | 12 |
Find the mean daily wages of the workers In the factory by using step deviation method. (T.S. Mar. ’16)
Solution:
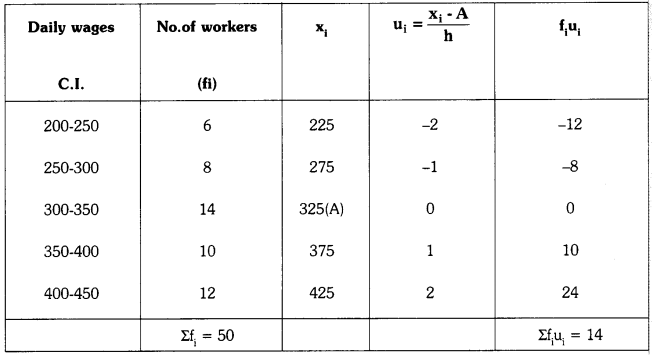
Assumed mean (A) = 325
Σfiui = 14; Σfi = 50
Class interval (h) = 50
Formula for the mean in step-deviation method \(\overline{\mathrm{x}}\) = a + \(\left[\frac{\Sigma \mathrm{f}_{\mathrm{i}} \mathrm{u}_{\mathrm{i}}}{\Sigma \mathrm{f}_{\mathrm{i}}} \times \mathrm{h}\right]\)
Now substituting the above values in the formula we get
\(\overline{\mathrm{x}}\) = 325 + [\(\frac{14}{50}\) × 50]
= 325 + 14 = 339
So mean daily wage of workers = 339
![]()
Question 11.
The following table gives production yield per hectare of wheat of 100 farmers of village. (T.S. Mar. ’16)
| Production yield Quint/Hec | 50-55 | 55-60 | 60-65 | 65-70 | 70-75 | 75-80 |
| Number of Farmers | 2 | 24 | 16 | 8 | 38 | 12 |
Draw both ogives for the above data. Hence obtain the median production yield.
Solution:
We consider upper limits of class on X-axis and cumulative frequency on Y-axis to draw more than ogive.
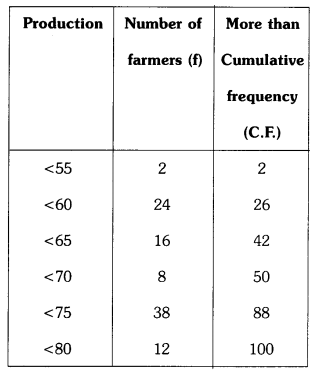
So the points (55, 2) (60, 26) (65, 42) (70, 50) (75, 88) and (80, 100) are to be plotted by choosing the
Scale :-
on X – axis 1 unit = 50
on Y – axis 1 unit = 10
We get more than ogive
Part II
To draw less than ogive, we choose lower limits on X- axis and less than cumulative frequency on Y – axis.
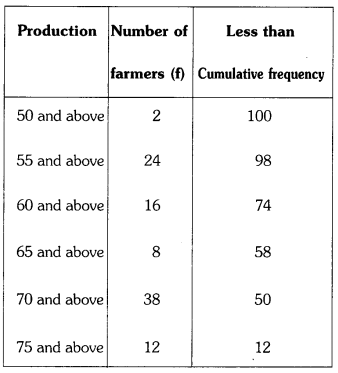
Now the points to be plotted on graph (50. 100) (55, 98) (60, 74) (65, 58) (70, 50) and (75, 12)
Scale :-
on X – axis 1 cm = 5 units
on Y – axis 1 cm = 10 units
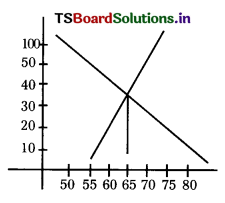
The above two curves cross at some point. Now we draw a perpendicular line to X-axis from this point.
The coordinate on X-axis (foot of perpendicular) is the median.
Additional Questions
Question 1.
Calculate the mean for the following.
| Class Interval | 10-20 | 20-30 | 30-40 | 40-50 | 50-60 |
| Frequency | 4 | 06 | 14 | 17 | 10 |
Solution:
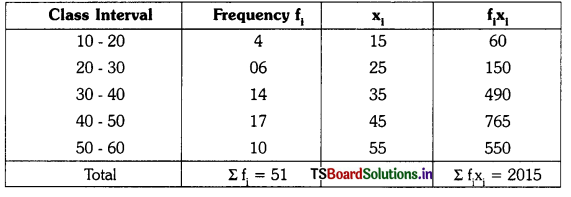
Here Σ fi = 51 ; Σ fixi = 2015
∴ We know \(\overline{\mathrm{x}}\) = \(\frac{\Sigma \mathrm{f}_{\mathrm{i}} \mathrm{x}_{\mathrm{i}}}{\Sigma \mathrm{f}_{\mathrm{i}}}\)
\(\overline{\mathrm{x}}\) = \(\frac{2015}{51}\) = 39.50
⇒ \(\overline{\mathrm{x}}\) = 39.50
Question 2.
Calculate the mean for the following.
| Class Interval | 15-25 | 25-35 | 35-45 | 45-55 | 55-65 | 65 -75 |
| Frequency | 7 | 14 | 18 | 12 | 6 | 7 |
Solution:
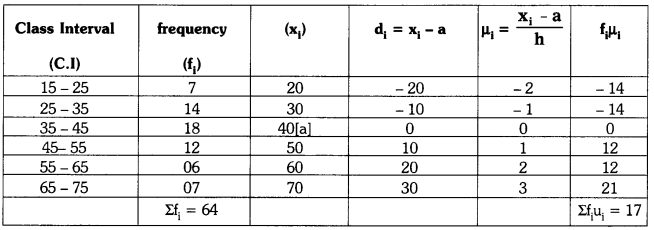
Here, assumed Mean a = 40
Size of the class h = 10
Σ fi = 64 ; Σ fiμi = 17
we know \(\overline{\mathrm{x}}\) = a + \(\frac{\Sigma \mathrm{f}_{\mathrm{j}} \mu_{\mathrm{i}}}{\Sigma \mathrm{f}_1}\) × h
\(\overline{\mathrm{x}}\) = 40 + \(\frac{17}{64}\) × 10
\(\overline{\mathrm{x}}\) = 40 + 2.65
\(\overline{\mathrm{x}}\) = 42.65
![]()
Question 3.
Find the Median for the following.
| Class Interval | 0-20 | 20-40 | 40-60 | 60-80 | 80-100 | 100-120 |
| Frequency | 11 | 18 | 26 | 17 | 6 | 4 |
Solution:
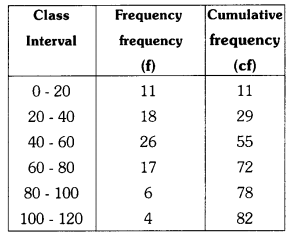
Here, n = 82 ; \(\frac{\mathrm{n}}{2}\) = \(\frac{82}{2}\) = 41
and median Lines on the 40 – 60
Lower limit l = 40
Cf = 29
f = 26
h = 20
Median = l + \(\frac{\left(\frac{n}{2}-c . f\right)}{f}\) × h
= 40 + \(\frac{(41-29) \times 20}{26}\)
= 40 + \(\frac{12 \times 20}{26}\)
= 40 + \(\frac{240}{26}\)
= 40 + 923 = 49.23
Question 4.
Find the median of the following data.
| Class Interval | 25-50 | 50-75 | 75-100 | 100-125 | 125-150 | 150-175 | 175-200 |
| Frequency | 10 | 22 | 30 | 32 | 12 | 18 | 06 |
Solution:
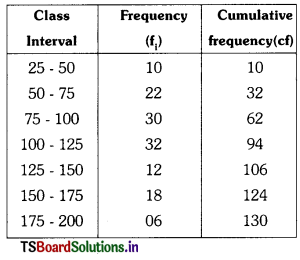
Here, n = 130 ; \(\frac{\mathrm{n}}{2}\) = \(\frac{130}{2}\) = 65
and median Lines on the = 100 – 125
Lower limit l = 100
f = 32
cf = 62
h = 25
Median = l + \(\frac{\left(\frac{n}{2}-c . f\right)}{f}\) × h
= 100 + \(\frac{(65-62) \times 25}{32}\)
= 100 + \(\frac{3 \times 25}{32}\)
= 100 + \(\frac{75}{32}\)
= 100 + 2.3 = 102.3
![]()
Question 5.
Find the Mode of the frequency distribution given below.
| Class Interval | 5-10 | 10-15 | 15-20 | 20-25 | 25-30 | 30-35 |
| Frequency | 3 | 6 | 14 | 21 | 08 | 6 |
Solution:
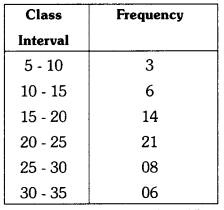
Here, Lower Limit l = 15
f1 = 14
f0 = 06
f2 = 21
We know mode = l + \(\left[\frac{\mathrm{f}_1-\mathrm{f}_0}{2 \mathrm{f}_1-\mathrm{f}_0-\mathrm{f}_2}\right]\) × h
= 15 + \(\left[\frac{14-6}{28-6-21}\right]\) × 5
= 15 + \(\frac{8 \times 5}{28-27}\)
= 15 + 40
= 55
Question 6.
The Median of the data \(\frac{\mathrm{K}}{\mathrm{6}}, \frac{\mathrm{K}}{4}, \mathrm{K}, \frac{\mathrm{K}}{\mathrm{3}}, \frac{\mathrm{K}}{2}\) is 14. Then find the “k” value.
Solution:
\(\frac{\mathrm{K}}{\mathrm{6}}, \frac{\mathrm{K}}{4}, \mathrm{K}, \frac{\mathrm{K}}{\mathrm{3}}, \frac{\mathrm{K}}{2}\)
Given Median \(\overline{\mathrm{x}}\) = 14
Here, x = \(\frac{\mathrm{K}}{\mathrm{3}}\)
∴ \(\frac{\mathrm{K}}{\mathrm{3}}\) = 14
K = 42
![]()
Question 7.
If the Mean and Median of a data are 32.5 and 37.62 respectively. Find the mode of the data.
Solution:
Given mean = 32.5
Median = 37.62
We know, mode = 3 (Median) – 2 (Mean)
= 3 (37.62) – 2 (32.5)
= 112.86 – 65
= 47.86
Question 8.
Find the mean when the median is 72.8 mode is 65.
Solution:
Given median = 72.8
Mode = 65
Mean = ?
We know, mode = 3 (Median) – 2 (Mean)
∴ Mean = \(\frac{3(\text { Median })-\text { Mode }}{2}\)
= \(\frac{3(72.8)-65}{2}\)
= \(\frac{218.4-65}{2}\)
= \(\frac{153.4}{2}\) = 76.7
Question 9.
Find the Median of the data given below.
Solution:
15, 20, 2, 17, 18, 76, 5
Ascending order : 2, 5, 15, 17, 18, 20, 76
So, median = 17
Question 10.
Find the Median for the following data
30, 17, 12, 21, 33, 22
Ascending order: 12, 17, 21, 22, 30, 33
Solution:
Here following data have two numbers have in median so, that
Median = \(\frac{21+22}{2}\)
= \(\frac{43}{2}\) = 21.5
![]()
Question 11.
Find the mode of the following data.
20, 3, 7, 13, 3, 4, 6, 7, 19, 15, 7, 18, 3
Solution:
Mode = 3, 7
Question 12.
If the median of 60 observations, below Is 28.5 find the value of x and y.
| Class Interval | 0-10 | 10-20 | 20-30 | 30-40 | 40-50 | 50-60 |
| Frequency | 5 | X | 20 | 15 | y | 5 |
Solution:
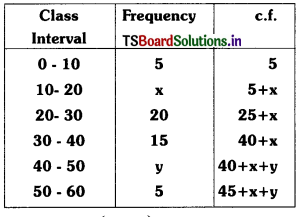
Median = l + \(\frac{\left(\frac{\mathrm{n}}{2}-\mathrm{cf}\right)}{\mathrm{f}}\) × h
given that Σf = n = 60
⇒ 45 + x + y = 60
⇒ x + y = 15 ……………. (1)
The median is 28.5 which lies between 20 and 30.
∴ Median class = 20 – 30
∴ l = lower boundary of the median class = 20
\(\frac{\mathrm{n}}{2}\) = \(\frac{60}{2}\) = 30
c.f = cumulative frequency = 5 + x and
h = 10
median = l + \(\frac{\left(\frac{\mathrm{n}}{2}-\mathrm{cf}\right)}{\mathrm{f}}\) h
28.5 = 20 + \(\frac{(30-5-x)}{20}\) × 10
28.5 = 20 + \(\frac{25-x}{2}\)
⇒ \(\frac{25-x}{2}\) = 28.5 – 20 = 8.5
25 – x = 2 × 8.5 = 17
x = 25 – 17 = 8
from (1) x + y = 15
8 + y = 15
y = 15 – 8 = 7
∴ x = 8, y = 7
![]()
Question 13.
Find the Median of 30 students.
| Marks | 40-45 | 45-50 | 50-55 | 55-60 | 60-65 | 65-70 | 70-75 |
| Number of students | 2 | 3 | 8 | 6 | 6 | 3 | 2 |
Solution:
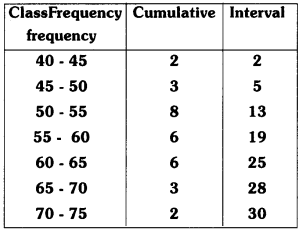
No. of observations = n = Σfi = 30
⇒ \(\frac{\mathrm{n}}{2}\) = \(\frac{30}{2}\) = 15
15 lies in the class 50 – 55
∴ Median dass = 50 – 55
∴ l = lower boundary of the median class = 50
f = frequency of the median class = 8
c.f = 5
class size = h = 6
Median = l + \(\frac{\left(\frac{\mathrm{n}}{2}-\mathrm{cf}\right)}{\mathrm{f}}\) × h
=50 + \(\left(\frac{15-5}{8}\right)\) × 6
= 50 + 125 × 6
= 50 + 7.5
= 57.5
∴ Median weight = 57.5 kg.
Question 14.
The mean of x + y observations Is x – y. find the sum of all the observations. Give mean of x + y observations is x – y. We know x = \(\frac{\Sigma f_i u_i}{f_i}\)
Solution:
Given x = x – y; Σfi = x + y
so x – y = \(\frac{\Sigma f_i u_i}{x+y}\)
Σfiui = (x + y) (x – y)
Σfiui = x2 – y2
![]()
Question 15.
Find the median and mode of the following observation. 12, 5, 9, 6, 14, 9 and 8.
Solution:
Given observations are 12, 5, 9, 6, 14, 8
= 5, 6, 8, 9, 12, 14
Median = \(\frac{8+9}{2}\)
= \(\frac{17}{2}\)
= 8.5
Mean x = \(\frac{5+6+8+9+12+14}{6}\)
= \(\frac{54}{6}\) = 9
Mode = 3(median) – 2(mean)
= 3(8.5) – 2(9)
= 25.5 – 18 = 43.5
Question 16.
Write the formula for calculating ‘Arithmetic mean’. In step deviation method and explain each letter in it.
Solution:
\(\overline{\mathrm{x}}\) = a + \(\left[\frac{\sum \mathrm{f}_{\mathrm{i}} \mathrm{u}_{\mathrm{i}}}{\sum \mathrm{f}_{\mathrm{i}}}\right]\) × h
![]()
Question 17.
For the following data if the Median of 60 observations Is 28.5 find the values of x and y.
| Class Interval | 0-10 | 10-20 | 20-30 | 30-40 | 40-50 | 50-60 |
| Frequency | 5 | X | 20 | 15 | y | 5 |
Solution:
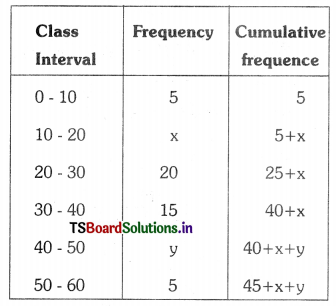
Here. given total observations are = 60
∴ 45 + x + y = 60
x + y = 60 – 45
x + y = 15
From the Table l = 30 ; f = 15; cf = 25 + x ; h = 60; M = 28.5
we know median M = l + \(\frac{\left[\frac{\mathrm{n}}{2}-\mathrm{cf}\right]}{\mathrm{f}}\) × h
∴ 30 + \(\frac{30-(25+x)}{15}\) × 60 = 28.5
30 + (30 – 25 – x) 4 = 28.5
30 + (5 – x )4 = 28.5
30 + 20 – 4x = 28.5
50 – 4x = 28.5
-4x = 28.5 – 50
-4x = -21.5
x = \(\frac{21.5}{4}\)
x = 5.03
we apply x = 5.03, In x + y = 15
5.03 + y = 15
y = 15 – 5.03
y = 9.97