
Reviewing AP Inter 2nd Year Economics Study Material Chapter 1 Descriptive Statistics Questions and Answers can help students prepare confidently for exams.
AP Inter 2nd Year Economics 1st Lesson Descriptive Statistics Questions and Answers
Very Short Answer Questions
Question 1.
The weekly wage of a worker in a month is: Rs. 500, Rs. 600, Rs. 400, Rs. 500. What is the mean weekly wage?
Answer:
1) Sum of wages ∑X = 500 + 600 + 400 + 500 = 2000 ;
Number of weeks (n) = 4
2) Mean \(\bar{X}=\frac{\Sigma X}{n}\)
= \(\frac{2000}{4}\) = 500
∴ Mean weekly wage = Rs. 500
Question 2.
Write the two properties of Arithmetic Mean.
Answer:
- The sum of the deviations of all observations from the mean is always zero. ∑ (X – \(\bar{X}\)) = 0
- Arithmetic Mean is influenced by extreme values in the data.
Question 3.
Differentiate between population data and sample data.
Answer:
| Population Data | Sample Data |
| 1) Population Data refers to the entire population of the group. | 1) Sample Data refers to a smaller part of the group. |
| 2) Collection of this data is more expensive. | 2) Collection of this data is less expensive. |
Question 4.
State difference between Less than Ogive and More than Ogive curves.
Answer:
| Less than ogive curve | More than ogive curve |
| 1) Less than ogive curve plots the cumulative frequencies against upper limits of the class intervals. | 1) More than ogive curve plots the cumulative frequencies against lower limits of the class intervals. |
| 2) This curve rises from left to right. | 2) This curve falls from left to right. |
Question 5.
Mention the parts of table in statistics.
Answer:
Parts of the Data table :
- Table Number
- Title
- Column Headings
- Row Headings (Stubs)
- Body of the Table
- Unit of Measurement
- Source
- Note

Question 6.
Calculate the median of Marks: 28, 15, 34, 20, 37, 56, 34, 68, 71, 62
Answer:
Ascending order of the given data: 15, 20, 28, 34, 34, 37, 56, 62, 68, 71.
Here, Number of observations n = 10 (even)
Median = \(\frac { Sum of the two middle values }{2}\)
= \(\frac{34+37}{2}=\frac{71}{2}\) = 35.5
Short Answer Questions
Question 1.
Explain the importance of statistics in Economics.
Answer:
Role of Statistics in Economics:
- Data in Precise form: Statistics helps an economist to present economic facts in a precise numerical form (like percentages, averages). This makes economic facts clear, precise, and more convincing instead of vague statements.
- Better understanding: Statistics helps in analysing and studying issues like poverty, unemployment, and inflation by providing data about their size and causes.
It makes analysis more meaningful and better understanding. - Policy Making : Governments and economists use statistical data to make plans, frame policies, and take decisions to solve economic problems.
- Measurement tools : Statistics is used to measure and calculate important indicators such as GDP, national income, and inflation, which show the condition of an economy.
Question 2.
Explain clearly any four types of data presentation with suitable examples.
Answer:
Types of Data Presentation:
1) Textual Presentation: Here, data are presented in the form of words and sentences.
Ex: Andhra pradesh state consists of 12 Coastal Andhra districts, 9 Rayalaseema districts and 7 Uttarandhra districts.
2) Tabular Presentation: Here, data are arranged in a table with rows and columns.
Ex: In Jr. IPE, the marks of 3 students in Maths, Economics and Commerce are tabulated here.
| Student | Maths | Economics | Commerce |
| Ram | 78 | 85 | 90 |
| Robert | 45 | 65 | 81 |
| Rahim | 62 | 90 | 75 |
The word data is used in both singular and plural form.
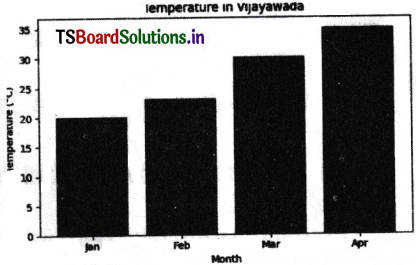
3) Bar Diagram: Here, data are shown using rectangular bars of respective heights.
Ex: Temperature in Vijayawada
| Month | Jan | Feb | Mar | Apr |
| Temp(°C) | 20 | 23 | 30 | 35 |
These values are presented here in bar diagram.
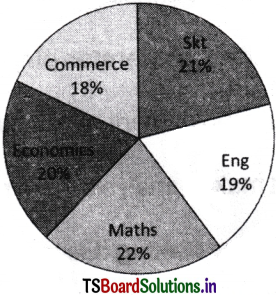
4) Pie Diagram: Here, data are presented as proportional slices or sectors of a circle of 360°.
The marks of an MEC Student in Jr. IPE are as follows:
Skt – 95,
Eng- 85,
Maths -100,
Economics – 90,
Commerce – 80.
These values are presented here in a pie diagram.
Question 3.
Differentiate between discrete series and continuous series in grouped data.
Answer:
Difference between Discrete Series and Continuous Series:
| Discrete Series | Continuous Series |
| 1) Data are presented in distinct values with corresponding frequencies. | 1) Data are presented in class intervals with corresponding frequencies. |
| 2) There are gaps between successive values. | 2) There are no gaps between class intervals. |
| 3) Frequency is assigned to each individual value. | 3) Frequency is assigned to a range of values (class interval). |
| 4) Uses actual values directly | 4) Uses midpoints of class intervals |
| 5) Ex: Number of books, students. | 5) Ex: Height, weight, temperature. |
Question 4.
What is the criteria for an ideal measure of central tendency?
Answer:
An ideal measure of central tendency should meet the following six criteria:
- Clearly Defined: It should be properly and clear (unambiguously) defined.
- Easy to Comprehend: It should be easy for a person to understand.
- Simple to Compute: The calculation process should be straightforward.
- Comprehensive: It should be based on all observations in the data set.
- Mathematical Properties: It should possess certain desirable mathematical properties.
- Stability: It should be least affected by the presence of extreme observations (outliers).
Question 5.
Calculate the Arithmetic Mean of wages for the following data using direct method.
| Weekly wage (Rs) | 250 | 350 | 450 | 550 | 550 |
| No. of workers | 10 | 15 | 20 | 10 | 5 |
Answer:
Let X = Value of variables (Weekly wage),
f = Frequency of each value (No. of workers).
| Weekly wage (Rs) (X) | No.of Workers(f) | fX |
| 250 | 10 | 2500 |
| 350 | 15 | 3500 |
| 450 | 20 | 9000 |
| 550 | 10 | 5500 |
| 55 | 5 | 3,250 |
| Total | ∑f = 60 | ∑fX = 25,500 |
∴ AM is \(\bar{X}=\frac{\Sigma f X}{\Sigma f}\)
= \(\frac{25,500}{60}\) = 425
Airthmetic Mean of wages = 425
Question 6.
Briefly explain the positional averages like Median, Quartile, Decile and Percentile.
Answer:
Positional averages (partition values) are measures of central tendency that divide a dataset into equal parts based on the position of observations after arranging the data in order (ascending or descending). They help us understand how the data is spread.
1) Median: Median divides the data into two equal parts:
- 50% of values (observations) lie below the median.
- 50% of values lie above the median.
2) Quartiles (Q1, Q2, Q3): Quartiles divide the data into four equal parts.
- Q1 (First Quartile): 25% of values lie below Q1
- Q2 (Second Quartile): 50% of values lie below Q2
- Q3 (Third Quartile): 75% of values lie below Q3
3) Deciles (D1 to D9): Deciles divide the data into ten equal parts.
- Each part represents 10% of the data.
- Ex: D6 : 60% of values lies below D6
4) Percentiles (P1 to P99): Percentiles divide the data into 100 equal parts.
- Each part represents 1 % of the data.
- Ex: P90 : 90% of values lies below P90
Note: Results in IIT-JEE, EAPCET are given in Percentiles.
Important Relation: Q2 = D5 = P50 = Median.
Thus 2nd quartile (Q2), 5th decile (D5), 50th percentile (P50) represent the same position in the data.
Long Answer Questions
Question 1.
Find the Mean and Median weight of the following distribution.
| Weight (in Kgs) | 30-40 | 40-50 | 50-60 | 60-70 | 70-80 | 80-90 | 90-100 |
| No of Persons | 4 | 7 | 3 | 19 | 25 | 29 | 13 |
Answer:
1) Finding Mean:
| Weight (in Kgs) | Mid point (m) | No of Persons (f) | mf |
| 3040 | 35 | 4 | 140 |
| 4050 | 45 | 7 | 315 |
| 5060 | 55 | 3 | 165 |
| 6070 | 65 | 19 | 1235 |
| 7080 | 75 | 25 | 1875 |
| 8090 | 85 | 29 | 2465 |
| 90100 | 95 | 13 | 1265 |
| Total ∑f = 100 | ∑mf =7,430 |
Mean \(\overline{\mathrm{X}}=\frac{\Sigma \mathrm{mf}}{\Sigma \mathrm{f}}\)
= \(\frac{7430}{100}\) = 74.3
∴ Mean weight = 74.3 kg
2) Finding Median: The Cumulative frequency table for the given data is as follows:
| Weight (in Kgs) | No of Persons(f) | Cumulative frequency (cf) |
| 30-40 | 4 | 4 |
| 40-50 | 7 | 11 |
| 50-60 | 3 | 14 |
| 60-70 | 19 | 33 (cf) |
| 70-80 | 25 (f) | 58 |
| 80-90 | 29 | 87 |
| 90-100 | 13 | 100 |
| Total N = 100 |
Total frequency N = 100
Median Position = \(\frac{N}{2}\)
= \(\frac{100}{2}\) = 50
Here Median Class = Class containing 50th item
The value in the cf column which is just above 50 is 58.
It belongs to class 70-80.
∴ Median class is 70-80.
Here L = 70,
h = 80 – 70 = 10,
f = 25,
cf = 33 (cf of before class)
Median = L + \(\left[\frac{\frac{\mathrm{N}}{2}-\mathrm{cf}}{\mathrm{f}}\right]\) × h
= 70 + \(\left[\frac{50-33}{25}\right]\) × 10
= 70 + \(\frac{17}{25}\) × 10
= 70 + (0.68 × 10)
= 70 + 6.8 = 76.8 kg
Question 2.
Find the Median and Mode of weekly wage of workers.
| Weekly wage (in ’00 Rs.) | 0-5 | 5-10 | 10-15 | 15-20 | 20-25 | 25-30 | 30-35 |
| No of workers | 2 | 7 | 11 | 20 | 22 | 14 | 4 |
Answer:
1) Finding Median:
The Cumulative frequency table for the given data is as follows:
| Weekly wage (in ’00 Rs.) | No.of Workers (f) | Cumulative frequency (cf) |
| 0-5 | 2 | 2 |
| 5-10 | 7 | 9 |
| 10-15 | 11 | 20 (cf) |
| 15-20 | 20 (f) | 40 |
| 20-25 | 22 | 62 |
| 25-30 | 14 | 76 |
| 30-35 | 4 | 80 |
| Total N = 80 |
Total frequency N = 80;
Median position \(\frac{N}{2}\) = \(\frac{80}{2}\) = 40
Here, Median Class = Class containing 40th item
The value in the cf column which is exactly equal to 40 is 40.
It belongs to class 15-20. Median class is 15-20.
Here L = 15,
h = 20 – 15 = 5,
f = 20,
cf = 20 (cf of before class)
Median (M) = L + \(\left[\frac{\frac{\mathrm{N}}{2}-\mathrm{cf}}{\mathrm{f}}\right]\) × h
= 15 + \(\left[\frac{40-20}{20}\right]\) × 5
= 15 + \(\frac{20}{20}\) × 5
= 15 + 5 = 20
The median weekly wage is 20.
In thousands (’00 Rs.) it is equal to Rs. 2,000.
2) Finding Mode:
We know Modal Class = Class with the largest frequency.
The highest frequency in the given table is 22.
So the modal class is 20-25.
Here, L = 20 (Lower limit of modal class);
f1 = 22 (Frequency of modal class)
f0 = 20 (Frequency of before modal class);
f2 = 14 (Frequency of after modal class),
∴ Median (Z) = L + \(\left(\frac{\mathrm{f}_1-\mathrm{f}_0}{2 \mathrm{f}_1-\mathrm{f}_0-\mathrm{f}_2}\right)\) × h
= 20 + \(\left[\frac{22-20}{2(22)-20-14}\right]\) × 5
= 20 + \(\left[\frac{2}{44-34}\right]\) × 5
= 20 + \(\left(\frac{2}{10}\right)\) × 5
= 20 + 1 = 21
The modal weekly wage is 21. In thousands(’00 Rs.) it is equal to Rs. 2,100.
Question 3.
Define Mean. Explain different methods of calculating arithmetic mean for ungrouped and grouped data.
Answer:
Mean is defined as the average of a set of observations.
Arithmetic Mean (\(\overline{\mathrm{X}}\)) is defined as the sum of ail observations divided by the total number of observations.
A) Arithmetic Mean (AM) for Ungrouped Data:
1) Direct Method:
Formula: AM is \(\bar{X}=\frac{\sum X}{n}\)
Where, X = Individual observations,
∑X = Sum of all observations,
n= Total number of observations
2) Assumed Mean Method:
Any particular value can be taken as assumed mean (A),
and deviations (d = X – A) are taken from it.
Formula: \(\overline{\mathrm{X}}\) = A + \(\frac{\Sigma \mathrm{d}}{\mathrm{n}}\)
Where, A = Assumed mean;
X = Individual observations;
n = Total number of observations,
d = X – A = Deviation of assumed mean
3) Step Deviation Method:
Here the deviations are divided by a common factor (c) to avoid large numerical figures.
Formula: \(\overline{\mathrm{X}}\) = A + \(\frac{\Sigma \mathrm{d}^{\prime}}{\mathrm{n}}\) × c
(where d’ = \(\frac{X-A}{c}\))
Where A = Assumed Mean,
∑d’ = Sum of step deviations,
n = Number of observations,
c = common factor (class size)
B) Arithmetic Mean (AM) for grouped Data:
I) Discrete series : In a discrete series, each observatio (X) is associated with a frequency (f)
1) Direct Method: Formula: \(\bar{X}=\frac{\Sigma f X}{\Sigma f}\)
2) Assumed Mean Method: Formula: \(\overline{\mathrm{X}}=\mathrm{A}+\frac{\Sigma \mathrm{fd}}{\Sigma \mathrm{f}}\)
3) Step Deviation Method: Formula: \(\overline{\mathrm{X}}=\mathrm{A}+\frac{\Sigma \mathrm{fd}^{\prime}}{\Sigma \mathrm{f}} \times \mathrm{c}\)
Here d = \(\frac{d}{c}\) (or)
d’ = \(\frac{(\mathrm{X}-\mathrm{A})}{\mathrm{c}}\) and
c = common factor (class size).
II) Continuous Series (frequency distribution): Here the data is divided into class intervals. Here the midpoint (m) of each class interval is used to represent the values in that range.
1) Direct Method: \(\bar{X}=\frac{\Sigma f m}{\Sigma f}\)
2) Assumed Mean Method: \(\overline{\mathrm{X}}=\mathrm{A}+\frac{\Sigma \mathrm{fd}}{\Sigma \mathrm{f}}\) (where d = m – A)
3) Step Deviation Method: \(\overline{\mathrm{X}}=\mathrm{A}+\frac{\Sigma \mathrm{fd}^{\prime}}{\Sigma \mathrm{f}} \times \mathrm{c}\) (where d’ = \(\frac{\mathrm{m}-\mathrm{A}}{\mathrm{c}}\)).
An Excellent Cricket Illustration – 1
Consider the scores of Virat and Rohit in Five ODI Matches of Worldcup.
| Match | Virat (Runs) | Rohit (Runs) |
| 1 | 27 | 48 |
| 2 | 54 | 52 |
| 3 | 54 | 63 |
| 4 | 61 | 71 |
| 5 | 169 | 71 |
Who is the Better Performer? Virat or Rohit; In what way he is better?
1) Mean (Arithmetic Average):
Virat’s total score in 5 matches = 365
∴ Mean = \(\frac{365}{5}\) = 73
Rohit’s total score in 5 matches = 305
∴ Mean = \(\frac{305}{5}\) = 61
Interpretation of Mean: Virat’s average score 73 is much better than Rohit’s 61.
So, Virat is the better performer. But, Virat’s average is heavily influenced by one extreme score of 169 runs. Thus, Mean can be effected by extremely high or low values.
2) Median (Middle Score):
Virat’s arranged scores: 27, 54, 54, 61, 169
⇒ Median = 54 (This is much lower than his mean 73)
Rohit’s arranged scores:48, 52, 63, 71,71
⇒ Median = 63 (This is very close to his mean 61)
For Virat: Two innings are below 54; two innings are above 54.
∴ Median score 54 is the centre of his performances.
For Rohit: Half of the innings are below 63; half are above 63.
So, Median score 63 is the centre of his performances.
Interpretation of Median: Rohit’s typical (central) performance is better than Kohli.
Thus, Rohit is more consistent. We would expect an innings score around 63 by Rohit.
The median score tells us what a batsman generally scores in a typical match because it is not affected by extremely low or high runs.
3) Mode (Most Frequent Score):
Virat: 27, 54, 54, 61,169
⇒ Mode = 54
Rohit: 48, 52, 63, 71, 71
⇒ Mode = 71
Mode indicates the batsman’s most common performance.
Interpretation of Mode: Virat most commonly scored 54 runs, while Rohit most commonly scored 71 runs.
Thus, in mode point of view Rohit is better.
Final Comparison and Conclusion:
| Measure | Virat | Rohit | What It Tells Us | Who is Better |
| Mean | 73 | 61 | Overall average performance | Virat |
| Median | 54 | 63 | Typical or central performance | Rohit |
| Mode | 54 | 71 | Most frequently occurring score | Rohit |
One-Sentence Summary:
- Mean measures overall performance.
- Median measures typical performance.
- Mode measures the most common performance.
Multiple Choice Questions
Question 1.
Which of the following is NOT a method of collecting primary data?
1) Questionnaire
2) Government reports
3) Observation
4) Personal interview
Answer:
2) Government reports
Question 2.
Grouping data according to attributes or characteristics, is an example of:
1) Geographical classification
2) Quantitative classification
3) Chronological classification
4) Qualitative classification
Answer:
4) Qualitative classification
Question 3.
The orderly arrangement of data in rows and columns is known as:
1) Classification
2) Graphical presentation
3) Tabulation
4) Pictorial presentation
Answer:
3) Tabulation
Question 4.
Bar diagram is:
1) One-dimensional diagram
2) Two-dimensional diagram
3) multiple-dimensional diagram
4) Three-dimensional diagram
Answer:
1) One-dimensional diagram
Question 5.
Data represented through arithmetic line graph help in understanding
1) long term trend
2) Cyclicity in data
3) seasonality in data
4) Short term trend
Answer:
1) long term trend
Question 6.
Ogive curves can be helpful in locating graphically:
1) mean
2) mode
3) median
4) Range
Answer:
3) median
Question 7.
If most of the data is bunched onto the right, then
1) Mode = Mean
2) Mean > Mode
3) Mode = Median
4) Mode > Mean
Answer:
4) Mode > Mean
Question 8.
The sum of deviations from mean is always:
1) Positive
2) Negative
3) zero
4) Infinity
Answer:
3) zero
Question 9.
The arithmetic mean is obtained by:
1) Multiplying the values together
2) Dividing the sum of values by the number of values
3) Dividing the number of values by the sum of values
4) Subtracting smallest value from the largest
Answer:
2) Dividing the sum of values by the number of values
Question 10.
The most frequently occurring value in a data set is called:
1)Mean
2) Median
3) Mode
4) Mean Deviation
Answer:
3) Mode
Fill in the Blanks
Question 1.
_________ is the most common measure of central tendency.
Answer:
Mean
Question 2.
Graphically, historgram gives the value of _________ of the frequency distribution.
Answer:
Mode
Question 3.
_________ is the actual value that separates one class from another without gaps.
Answer:
Class boundaries
Question 4.
Mean > Median > Mode, if most of the data is bunched to the _________.
Answer:
left
Question 5.
If Mean = 3 and Median = 5, then Mode is _________.
Answer:
9
Hint: Mode = 3 Median – 2 Mean
= 3(5) – 2(3)
= 15 – 6 = 9.
III. One Word Answers
Question 1.
What are the components of a pie diagram called?
Answer:
The components of a pie diagram are called Sectors / Slices.
Question 2.
What is the difference between the lower limit and upper limit of a class called?
Answer:
The difference between the lower limit and upper limit of a class is called Class interval.
Question 3.
What is the middle value of an ordered data set called?
Answer:
The middle value of an ordered data set is called Median.
Question 4.
What is the term used to name the heading of a row in a table?
Answer:
The term used to name the heading of a row in a table is Stub.
Question 5.
What is the empirical formula to find mode for a moderately skewed distribution?
Answer:
Empirical Formula: Mode = 3 Median – 2 Mean.