
Referring to the AP Inter 1st Year Maths Study Material Chapter 5 Linear Inequalities Exercise 5d Solutions makes it easier to understand complex problems.
AP Inter 1st Year Maths Linear Inequalities Solutions Exercise 5d
Solve the following system of inequalities graphically.
Question 1.
x ≥ 3, y ≥ 2.
Solution:
Given that x ≥ 3 … (1)
y ≥ 2 …(2)
The graph of the lines, and x = 3 and y = 2, are drawn in the figure.
Inequality x ≥ 3 represents the region on the right hand side of the line, (including the line x = 2) and inequality y ≥ 2 represents the region above the line, (including the line y = 2).
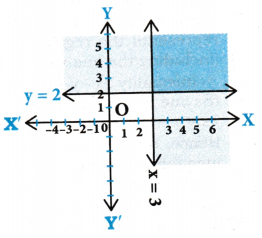
Hence, the solution of the given system of linear inequalities is represented by the common shaded region including the points on the respective lines as shown in graph.
Question 2.
3x + 2y ≤ 12, x ≥ 1, y ≥ 2.
Solution:
Given that 3x + 2y ≤ 12 … (1)
x ≥ 1 ..(2)
y ≥ 2 … (3)
The graphs of the lines, 3x + 2y = 12, x = 1 and y = 2, are drawn in the figure. Inequality represents the region below the line 3x + 2y = 12 (including the line 3x + 2y = 12).
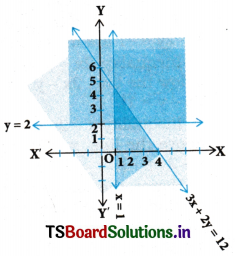
Inequality x ≥ 1 represents the region on the right hand side of the line x = 1 (including the line x= 1).
Inequality y ≥ 2 represents the region above the line, y = 2 (including the line y = 2).
Hence, the solution of the given system of linear inequalities is represented by the common shaded region including the points on the respective lines as shown in graph.
Question 3.
2x + y ≥ 6, 3x + 4y ≤ 12.
Solution:
Given that 2x + y ≥ 6 … (1)
3x + 4y ≤ 12 …(2)
The graphs of the lines, 2x + y = 6 and 3x + 4y = 12 are drawn in the figure.
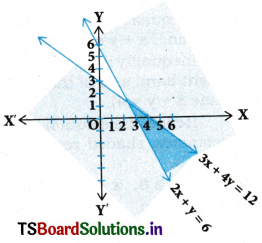
Inequality 2x + y ≥ 6 represents the region above the line, 2x + y = 6 (including the line 2x + y = 6).
Inequality 3x + 4y ≤ 12 represents the region below the line, 3x + 4y = 12 (including the line 3x + 4y = 12).
Hence, the solution of the given system of linear inequalities is represented by the common shaded region including the points on the respective lines as shown in graph.

Question 4.
x + y ≥ 4, 2x – y < 0
Solution:
Given that x + y ≥ 4 … (1)
2x – y < 0 ….. (2)
The graphs of the lines, x + y = 4 and 2x – y = 0 are drawn in the figure. Inequality x + y > 4 represents the region above the line, x + y = 4 (including the line x + y = 4).
Inequality 2x – y < 0 represents the region above the line 2x – y = 0 (excluding the points on the line 2x-y = 0).
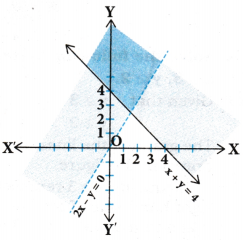
Hence, the solution of the given system of linear inequalities is represented by the common shaded region excluding the points on the line 2x – y = 0 as shown in graph.
Question 5.
2x – y > 1, x – 2y < – 1.
Solution:
Given that 2x – y > 1 … (1)
x- 2y < -1 … (2)
The graphs of the lines, 2x – y = 1 and x – 2y = -1 are drawn in the figure.
Inequality 2x – y > 1 represents the region below the line, 2x – y = 1 (excluding the line 2x-y = 1).
Inequality x – 2y < – 1 represents the region above the line, x – 2y = -1 (excluding the line x – 2y = -1).
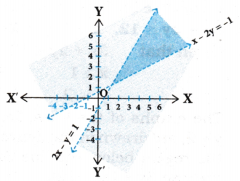
Hence, the solution of the given system of linear inequalities is represented by the common shaded region excluding the points on the respective lines as shown in graph.
Question 6.
x + y ≤ 6, x + y ≥ 4.
Solution:
Given that x + y ≤ 6 … (1)
x + y ≥ 4 … (2)
The graphs of the lines, x + y = 6 and x + y = 4 and drawn in the figure.
Inequality x + y ≤ 6 represents the region below the line, x + y = 6 (including the line x + y = 6).
Inequality x + y ≥ 4 represents the region on the right hand side of the line, x + y = 4 (including the line x + y = 4).
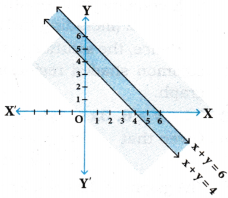
Hence, the solution of the given system of linear inequalities is represented by the common shaded region including the points on the respective lines as shown in graph.
Question 7.
2x + y ≥ 8, x + 2y ≥ 10.
Solution:
Given that 2x + y ≥ 8 … (1)
x + 2y ≥ 10 … (2)
The graphs of the lines, 2x + y = 8 and x + 2y = 10 are drawn in the figure.
Inequality 2x + y ≥ 8 represents the region above the line,
2x + y = 8 (including the line).
Inequality x + 2y ≥ 10 represents the region on the right hand side of the line, x + 2y = 10 (including the line).
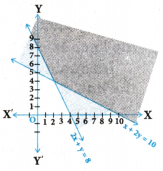
Hence, the solution of the given system of linear inequalities is represented by the common shaded region including the points on the respective lines as shown in graph.
Question 8.
x + y ≤ 9, y > x, x ≥ 0.
Solution:
Given that x + y ≤ 9 … (1)
y > x …(2)
x ≥ 0 …(3)
The graph of the lines, x + y = 9 and y = x, are drawn in the figure.
Inequality x + y ≤ 9 represents the region below the line, x + y = 9 (including the line x + y = 9).
It is observed that (0, 1) satisfies the inequality, y > x. Since, 1 > 0.
Therefore, inequality y > x represents the half plane, corresponding to the line, y = x, containing the point (0,1), (excluding the line y = x).
Inequality x ≥ 0 represents the region on the right hand side of the line, x = 0 or Y-axis (including the Y-axis).
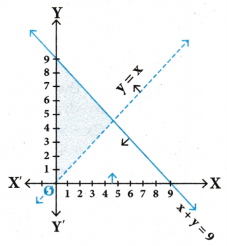
Hence, the solution of the given system of linear inequalities is represented by the common shaded region including the points on the lines, x + y = 9 and x = 0, but excluding the points on line y = x as shown in graph.
Question 9.
5x + 4y ≤ 20, x ≥ 1, y ≥ 2.
Solution:
5x + 4y < 20 …(1)
x ≥ 1 …(2)
y ≥ 2 …(3)
The graph of the lines, 5x + 4y = 20, x = 1 and y = 2, are
Inequality 5x + 4y < 20 represents the region below the line, 5x + 4y = 20 (including the line 5x + 4y = 20).
Inequality x ≥ 1 represents the region on the right side of line, x = 1 (including the line x = 1).
Inequality y ≥ 2 represents the region above the line, y = 2 (including the line y = 2).
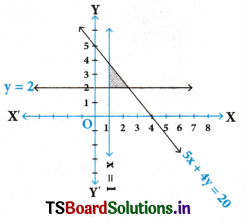
Hence, the solution of the given system of linear inequalities is represented by the common shaded region including the points on the respective lines as shown in graph.
Question 10.
3x + 4y ≤ 60, x + 3y ≤ 30, x ≥ 0, y ≥ 0.
Solution:
Given that 3x + 4y ≤ 60 … (1)
x + 3y ≤ 30 …..(2)
x ≥ 0, y ≥ 0 … (3)
The graph of the lines, 3x + 4y = 60 and x + 3y = 30, are drawn in the figure.
Inequality 3x + 4y ≤ 60 represents the region below the line, 3x + 4y = 60 (including the line 3x + 4y = 60).
Inequality x +3y ≤ 30 represents the region below the line, x + 3y = 30 (including the line x + 3y = 30).
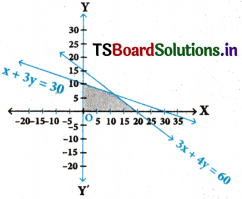
Since x ≥ 0 and y ≥ 0, every point in the common shaded region in the first quadrant including the points on the respective lines and the axes represents the solution of the given system of linear inequalities as shown in graph.
Question 11.
2x + y ≥ 4, x + y ≤ 3, 2x – 3y ≤ 6.
Solution:
Given that 2x + y ≥ 4 …(1)
x + y ≤ 3 …(2)
2x – 3y ≤ 6 …(3)
The graph of the lines, 2x + y = 4, x + y = 3 and 2x – 3y = 6, are drawn in the figure.
Inequality 2x + y ≥ 4 represents the region the line, 2x + y = 4 (including the line).
Inequality x + y ≤ 3 represents the region the line, x + y = 3 (including the line).
Inequality 2x – 3y ≤ 6 represents the region the line, 2x – 3y = 6 (including the line).
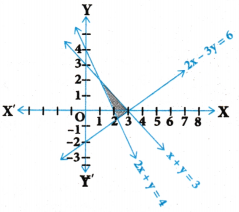
Hence, the solution of the given system of linear inequalities is represented by the common shaded region including the points on the respective lines as shown in graph.
Question 12.
x – 2y ≤ 3, 3x + 4y ≥ 12, x ≥ 0, y ≥ 1.
Solution:
Given that x – 2y ≤ 3 … (1)
3x + 4y ≥ 12 …(2)
x ≥ 0 …(3)
y ≥ 1 …(3)
The graphs of the lines, x – 2y = 3, 3x + 4y = 12, x = 0 and y = 1 are drawn in the figure.
Inequality x – 2y ≤ 3 represents the region above the line, x – 2y = 3 (including the line).
Inequality 3x + 4y ≥ 12 represents region above the line, 3x + 4y = 12 (including the line).
Inequality y ≥ 1 represents the region above the line, y = 1 (including the line).
Inequality x ≥ 0 represents the region on the right hand side of Y-axis (including Y-axis).
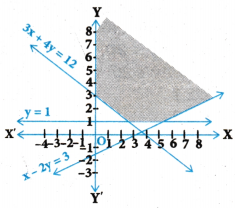
Hence, the solution of the given system of linear inequalities is represented by the common shaded region including the points on the respective lines and Y-axis as shown in graph.
Question 13.
4x + 3y ≤ 60, y ≥ 2x, x ≥ 3; x, y ≥ 0.
Solution:
Given that 4x + 3y ≤ 60 ………..(1)
y ≥ 2x, …………(2)
x ≥ 3; …………(3)
The graph of the lines, 4x + 3y = 60, y = 2x and x = 3, are drawn in the figure.
Inequality 4x + 3y ≤ 60 represents the region below the line, 4x + 3y = 60 (including the line 4x + 3y = 60).
Inequality y ≥ 2x represents the region above the line, y = 2x (including the line y = 2x).
Inequality x ≥ 3 represents the region on the right hand side of the line, x = 3 (including the line x = 3).
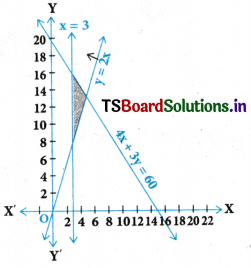
Hence, the solution of the given system of linear inequalities is represented by the common shaded region including the points on the respective lines as shown in graph.
Question 14.
3x + 2y ≤ 150, x + 4y ≤ 80, x ≤ 15, y ≥ 0, x ≥ 0.
Solution:
3x + 2y ≤ 150 … (1)
x + 4y ≤ 80 … (2)
x ≤ 15 … (3)
The graph of the lines 3x + 2y = 150, x + 4y = 80 and x = 15, are drawn in the figure.
Inequality 3x + 2y ≤ 150 represents the region below the line, 3x + 2y = 150 (including the line 3x + 2y = 150).
Inequality x + 4y ≤ 80 represents the region below the line, x + 4y = 80 (including the line x + 4y = 80).
Inequality x ≤ 15 represents the region on the left hand side of the line, x = 15 (including the line x = 15).
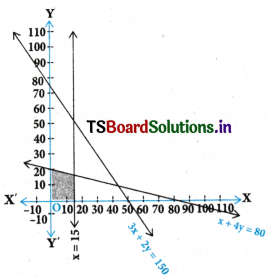
Since x ≥ 1 and y ≤ 0, every point in the common shaded region in the first quadrant including the points on the respective lines and the axes represents the solution of the given system of linear inequalities as shown in graph.
Question 15.
x + 2y ≤ 10, x + y ≥ 1, x – y ≤ 0, x ≥ 0, y ≥ 0.
Solution:
Given that x + 2y ≤ 10 … (1)
x + y ≥ 1 …(2)
x – y ≤ 0 …(3)
The graph of the lines, x + 2y = 10, x + y = 1 and x – y = 0 are drawn in the figure.
Inequality x + 2y ≤ 10 represents the region below the line, x + 2y = 10 (including the line x + 2y = 10).
Inequality x + y ≥ 1 represents the region above the line, x + y = 1 (including the line x + y = 1).
Inequality x – y ≤ 0 represents the region above the line, x – y = 0 (including the line x – y = 0).
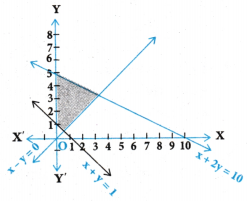
Since x ≥ 0 and y ≥ 0, every point in the common shaded region in the first quadrant including the points on the respective lines and the axes represents the solution of the given system of linear inequalities as shown in graph.